OT_fixed_pt_vs_FastICA.ipynb
Optimal Transport in linear ICA
In this notebook we test the performance of a OT Fixed Point ICA versus Fast ICA over dimensions, the latter also uses Fixed point alg as it's contrast function is infinitely differentiable.
import numpy as np
import torch
import matplotlib.pyplot as plt
import pandas as pd
import seaborn as sns
from sklearn.decomposition import FastICA
from tqdm.notebook import tqdm

# Import your package
from wasserstein_ica import WassersteinICA
# ==========================================
# 1. Helpers & Data Generation
# ==========================================

def amari_error(W_est, A_true):
    if W_est is None or np.any(np.isnan(W_est)):
        return np.nan

    P = np.abs(W_est @ A_true)
    n = P.shape[0]

    row_sum = np.sum(P, axis=1)
    row_max = np.max(P, axis=1)
    term1 = np.sum((row_sum / row_max) - 1)

    col_sum = np.sum(P, axis=0)
    col_max = np.max(P, axis=0)
    term2 = np.sum((col_sum / col_max) - 1)

    return (term1 + term2) / (2 * n)

def generate_dataset(n_dim, n_samples, seed=None):
    if seed is not None:
        np.random.seed(seed)
        torch.manual_seed(seed)

    # Standard Laplace (Super-Gaussian)
    sources = [np.random.laplace(0, 1, n_samples) for _ in range(n_dim)]
    S = np.stack(sources)

    # Well-conditioned mixing matrix
    cond_num = 1000
    while cond_num > 100:
        A = np.random.randn(n_dim, n_dim)
        cond_num = np.linalg.cond(A)

    X = A @ S
    return torch.tensor(X, dtype=torch.float32), A
# ==========================================
# 2. Experiment Setup
# ==========================================

# Test a range of dimensions up to 30
DIMENSIONS = [n for n in range(5, 51, 5)]  # Varying D
N_SAMPLES = 5000
N_TRIALS = 5  # Run multiple trials for error bars

print(f"--- FastICA vs. OT Fixed-Point Showdown ---")
print(f"Dimensions: {DIMENSIONS}")
print(f"Samples: {N_SAMPLES}")
print(f"Trials per dim: {N_TRIALS}")

results = []
--- FastICA vs. OT Fixed-Point Showdown ---
Dimensions: [5, 10, 15, 20, 25, 30, 35, 40, 45, 50]
Samples: 5000
Trials per dim: 5
# ==========================================
# 3. Main Loop
# ==========================================

for dim in tqdm(DIMENSIONS, desc="Dimensions"):
    for trial in range(N_TRIALS):
        # 1. Generate Data
        X_torch, A_true = generate_dataset(n_dim=dim, n_samples=N_SAMPLES, seed=trial)
        X_np = X_torch.numpy()

        # 2. FastICA (Baseline)
        try:
            fast_ica = FastICA(n_components=dim, max_iter=2000, tol=1e-4, random_state=trial)
            fast_ica.fit(X_np.T)
            W_fast_total = fast_ica.components_
            score_fast = amari_error(W_fast_total, A_true)
        except Exception as e:
            score_fast = np.nan
            W_fast_total = None

        results.append({'Dimension': dim, 'Method': 'FastICA', 'Amari Error': score_fast})

        # 3. Initialize WassersteinICA
        ica = WassersteinICA(X_torch)
        ica.whiten()
        W_white_np = ica.W_white.cpu().numpy()

        # 4. Wasserstein Fixed-Point (Cold Start - Random)
        try:
            # We don't pass init_w, so it starts random
            W_sphere_cold = ica.optimize_fixed_point(n_components=dim, max_iter=100, tol=1e-5)
            W_wass_cold_total = W_sphere_cold.cpu().numpy() @ W_white_np
            score_cold = amari_error(W_wass_cold_total, A_true)
        except Exception as e:
            score_cold = np.nan

        results.append({'Dimension': dim, 'Method': 'W-ICA (Cold Start)', 'Amari Error': score_cold})

        # 5. Standalone WassersteinICA (Phase 1 + OT Gradient Polish)
        try:
            # PHASE 1: Robust Deflation (Find the mountains)
            extracted_ws = []
            for _ in range(dim):
                prev = torch.stack(extracted_ws) if extracted_ws else None
                # Using 50 restarts to guarantee we avoid local minima
                w, _ = ica.optimize_wasserstein2(prev_components=prev, max_iter=200, n_restarts= 50)
                extracted_ws.append(w)
            W_deflation_init = torch.stack(extracted_ws)

            # PHASE 2: OT Gradient Polish (Climb to the peaks symmetrically)
            # We feed the Phase 1 output into the new OT gradient step
            W_sphere_wass = ica.optimize_fixed_point(n_components=dim, max_iter=100, tol=1e-5, init_w=W_deflation_init, step_size=0.5)

            W_wass_total = W_sphere_wass.cpu().numpy() @ W_white_np
            score_wass = amari_error(W_wass_total, A_true)
        except Exception as e:
            print(f"Failed at dim {dim}: {e}")
            score_wass = np.nan

        results.append({'Dimension': dim, 'Method': 'Standalone W-ICA', 'Amari Error': score_wass})
Dimensions: 0%| | 0/10 [00:00<?, ?it/s]
df = pd.DataFrame(results)

plt.figure(figsize=(10, 6))
# seaborn's lineplot automatically plots the mean and a confidence interval for the trials
sns.lineplot(data=df, x='Dimension', y='Amari Error', hue='Method', marker='o', linewidth=2.5)

plt.title("Amari Error vs. Dimension\n(FastICA vs. Wasserstein Fixed-Point)", fontsize=14)
plt.ylabel("Amari Error (Lower is Better)", fontsize=12)
plt.xlabel("Number of Dimensions", fontsize=12)
plt.grid(True, linestyle='--', alpha=0.7)
#plt.yscale('log') # Log scale is often better for Amari Error to see small polish improvements
plt.tight_layout()
plt.show()

# Display mean scores table
display(df.groupby(['Dimension', 'Method'])['Amari Error'].mean().unstack().round(4))
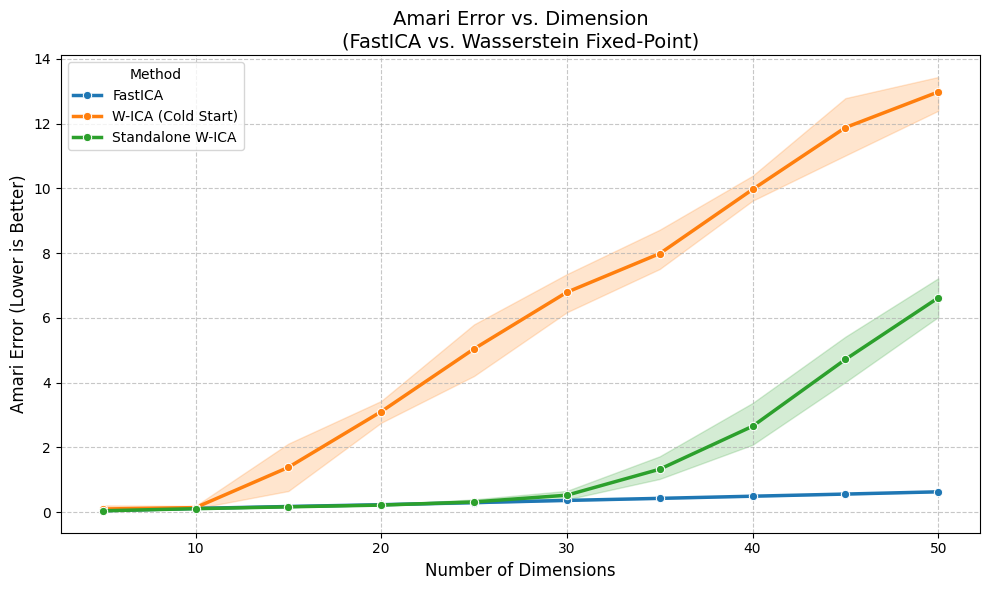
| Method | FastICA | Standalone W-ICA | W-ICA (Cold Start) |
|---|---|---|---|
| Dimension | |||
| 5 | 0.0482 | 0.0447 | 0.1003 |
| 10 | 0.1183 | 0.1098 | 0.1428 |
| 15 | 0.1771 | 0.1666 | 1.3867 |
| 20 | 0.2324 | 0.2208 | 3.1077 |
| 25 | 0.2971 | 0.3181 | 5.0471 |
| 30 | 0.3653 | 0.5264 | 6.7954 |
| 35 | 0.4287 | 1.3293 | 7.9887 |
| 40 | 0.4952 | 2.6556 | 9.9702 |
| 45 | 0.5612 | 4.7199 | 11.8817 |
| 50 | 0.6310 | 6.6228 | 12.9816 |