ppt_samples.ipynb
import numpy as np
import matplotlib.pyplot as plt
from mpl_toolkits.mplot3d.art3d import Line3DCollection
# Define the parallelepiped generation function
def generate_points_in_parallelepiped(center, eigvecs, eigvals, scale_factor, n_points=200):
# Uniform random coefficients in [-1,1]
coeffs = np.random.uniform(-1, 1, size=(n_points, 3))
# Scale by sqrt eigenvalues and scale factor
scaled = coeffs * (np.sqrt(eigvals) * scale_factor)
# Apply eigenvector matrix rotation and translation by center
points = scaled @ eigvecs.T + center
return points
# Define parallelepiped vertices from corners in coefficient space
def get_parallelepiped_vertices(center, eigvecs, eigvals, scale_factor):
corners = np.array([[ 1, 1, 1],
[ 1, 1,-1],
[ 1,-1, 1],
[ 1,-1,-1],
[-1, 1, 1],
[-1, 1,-1],
[-1,-1, 1],
[-1,-1,-1]])
scaled_corners = corners * (np.sqrt(eigvals) * scale_factor)
vertices = scaled_corners @ eigvecs.T + center
return vertices
# Parameters
center = np.array([0, 0, 0])
covariance = np.array([[3, 1, 0.5], [1, 2, 0.3], [0.5, 0.3, 1]])
eigvals, eigvecs = np.linalg.eigh(covariance)
scale_factor = 4
# Generate points inside the parallelepiped
points = generate_points_in_parallelepiped(center, eigvecs, eigvals, scale_factor, n_points=200)
# Get vertices of the parallelepiped
vertices = get_parallelepiped_vertices(center, eigvecs, eigvals, scale_factor)
# Edges between vertices to plot
edges_idx = [(0,1),(0,2),(0,4),(1,3),(1,5),(2,3),(2,6),(3,7),
(4,5),(4,6),(5,7),(6,7)]
# Plot
fig = plt.figure()
ax = fig.add_subplot(111, projection='3d')
ax.scatter(points[:,0], points[:,1], points[:,2], alpha=0.7)
# Construct lines for edges
lines = [(vertices[start], vertices[end]) for start,end in edges_idx]
lc = Line3DCollection(lines, colors='red', linewidths=1, linestyles='dashed')
ax.add_collection(lc)
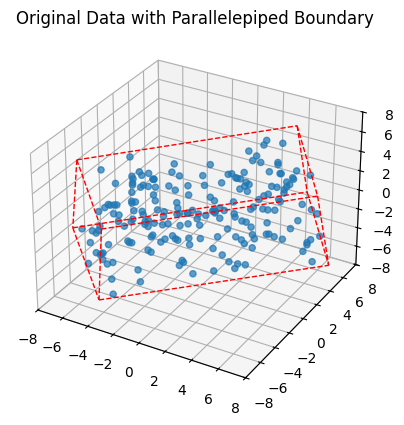
ax.set_title("Original Data with Parallelepiped Boundary")
ax.set_xlim(-8,8)
ax.set_ylim(-8,8)
ax.set_zlim(-8,8)
plt.show()
import numpy as np
import matplotlib.pyplot as plt
from mpl_toolkits.mplot3d.art3d import Line3DCollection
# Generate whitened data points uniformly inside a cube [-1, 1]^3
cube_points = np.random.uniform(low=-1, high=1, size=(200, 3))
# Compute boundary limits from points to fit a tight cube
min_val = np.min(cube_points)
max_val = np.max(cube_points)
half_side = max(abs(min_val), abs(max_val))
# Define vertices of cube boundary around data points
vertices = np.array([[-half_side, -half_side, -half_side],
[ half_side, -half_side, -half_side],
[ half_side, half_side, -half_side],
[-half_side, half_side, -half_side],
[-half_side, -half_side, half_side],
[ half_side, -half_side, half_side],
[ half_side, half_side, half_side],
[-half_side, half_side, half_side]], dtype=float)
# Edges of the cube to draw
edges_idx = [(0,1),(1,2),(2,3),(3,0),
(4,5),(5,6),(6,7),(7,4),
(0,4),(1,5),(2,6),(3,7)]
# Create plot
fig = plt.figure()
ax = fig.add_subplot(111, projection='3d')
# Plot points
ax.scatter(cube_points[:,0], cube_points[:,1], cube_points[:,2], color='blue', alpha=0.6, s=20)
# Plot cube edges
lines = [(vertices[start], vertices[end]) for start,end in edges_idx]
lc = Line3DCollection(lines, colors='red', linewidths=1.5, linestyles='dashed')
ax.add_collection(lc)
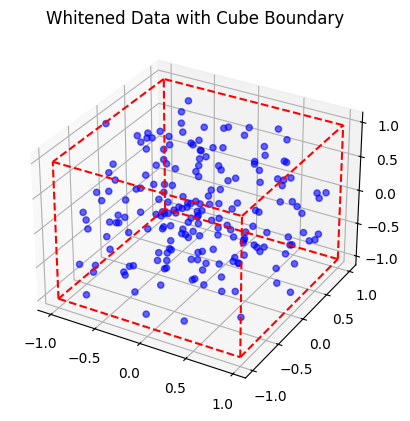
ax.set_title('Whitened Data with Cube Boundary')
# Set equal aspect ratio helper function
def set_axes_equal(ax):
'''Set 3D plot axes to equal scale.'''
x_limits = ax.get_xlim3d()
y_limits = ax.get_ylim3d()
z_limits = ax.get_zlim3d()
x_range = abs(x_limits[1] - x_limits[0])
x_middle = np.mean(x_limits)
y_range = abs(y_limits[1] - y_limits[0])
y_middle = np.mean(y_limits)
z_range = abs(z_limits[1] - z_limits[0])
z_middle = np.mean(z_limits)
plot_radius = 0.5 * max([x_range, y_range, z_range])
ax.set_xlim3d([x_middle - plot_radius, x_middle + plot_radius])
ax.set_ylim3d([y_middle - plot_radius, y_middle + plot_radius])
ax.set_zlim3d([z_middle - plot_radius, z_middle + plot_radius])
# Apply equal axis scaling
set_axes_equal(ax)
plt.show()
import numpy as np
import matplotlib.pyplot as plt
from mpl_toolkits.mplot3d.art3d import Line3DCollection
def rodrigues_rotation_matrix(axis, theta):
"""
Compute the rotation matrix using Rodrigues' formula.
axis: 3-element array to rotate about (should be unit vector)
theta: rotation angle in radians
"""
axis = axis / np.linalg.norm(axis)
a = np.cos(theta / 2.0)
b, c, d = -axis * np.sin(theta / 2.0)
R = np.array([[a*a + b*b - c*c - d*d,
2*(b*c - a*d),
2*(b*d + a*c)],
[2*(b*c + a*d),
a*a + c*c - b*b - d*d,
2*(c*d - a*b)],
[2*(b*d - a*c),
2*(c*d + a*b),
a*a + d*d - b*b - c*c]])
return R
# Generate whitened data points uniformly inside a cube [-1, 1]^3
cube_points = np.random.uniform(low=-1, high=1, size=(200, 3))
# Compute boundary limits and half side length
min_val = np.min(cube_points)
max_val = np.max(cube_points)
half_side = max(abs(min_val), abs(max_val))
# Define vertices of the cube boundary (centered at origin)
vertices = np.array([[-half_side, -half_side, -half_side],
[ half_side, -half_side, -half_side],
[ half_side, half_side, -half_side],
[-half_side, half_side, -half_side],
[-half_side, -half_side, half_side],
[ half_side, -half_side, half_side],
[ half_side, half_side, half_side],
[-half_side, half_side, half_side]], dtype=float)
# Define edges of the cube
edges_idx = [(0,1),(1,2),(2,3),(3,0),
(4,5),(5,6),(6,7),(7,4),
(0,4),(1,5),(2,6),(3,7)]
# Rotation parameters
rotation_axis = np.array([1, 1, 1]) # Diagonal axis through opposite vertices
rotation_axis = rotation_axis / np.linalg.norm(rotation_axis) # normalize
theta = np.radians(30) # rotate 30 degrees
# Compute rotation matrix
R = rodrigues_rotation_matrix(rotation_axis, theta)
# Rotate vertices and points
rotated_vertices = (R @ vertices.T).T
rotated_points = (R @ cube_points.T).T
# Plot
fig = plt.figure()
ax = fig.add_subplot(111, projection='3d')
# Scatter rotated points
ax.scatter(rotated_points[:,0], rotated_points[:,1], rotated_points[:,2], color='blue', alpha=0.6, s=20)
# Draw rotated cube edges
lines = [(rotated_vertices[start], rotated_vertices[end]) for start,end in edges_idx]
lc = Line3DCollection(lines, colors='red', linewidths=1.5, linestyles='dashed')
ax.add_collection(lc)
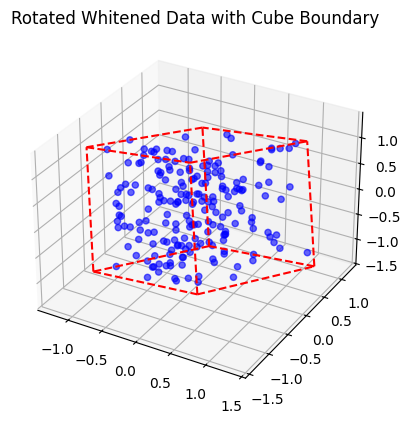
ax.set_title('Rotated Whitened Data with Cube Boundary')
# Set equal aspect ratio helper function
def set_axes_equal(ax):
'''Set 3D plot axes to equal scale.'''
x_limits = ax.get_xlim3d()
y_limits = ax.get_ylim3d()
z_limits = ax.get_zlim3d()
x_range = abs(x_limits[1] - x_limits[0])
x_middle = np.mean(x_limits)
y_range = abs(y_limits[1] - y_limits[0])
y_middle = np.mean(y_limits)
z_range = abs(z_limits[1] - z_limits[0])
z_middle = np.mean(z_limits)
plot_radius = 0.5 * max([x_range, y_range, z_range])
ax.set_xlim3d([x_middle - plot_radius, x_middle + plot_radius])
ax.set_ylim3d([y_middle - plot_radius, y_middle + plot_radius])
ax.set_zlim3d([z_middle - plot_radius, z_middle + plot_radius])
# Apply equal axis scaling
set_axes_equal(ax)
plt.show()