-
sorting-algorithm-performance-analysis
-
 data
data
-
report
-
results
-
src
-
tests
-
 .gitignore
-
README.md
-
environment.yml
Empirical Evaluation of Classic Sorting Algorithms
Data Structures And Algorithm Analysis
This project explores the relative empirical performances of four fundamental sorting algorithms:
- Quick Sort (Random Pivot)
- Quick Sort (Deterministic Pivot)
- Merge Sort
- Heap Sort
The goal is to evaluate these algorithms by comparing their number of comparisons, execution time, and memory usage when sorting datasets of various sizes. This project emphasizes empirical evaluation, analyzing performance with both randomly generated datasets and specially ordered datasets (non-decreasing and non-increasing order).
Overview
The project benchmarks the sorting algorithms across a range of dataset sizes (10,000 to 800,000 elements). It measures performance by counting the number of comparisons, recording execution time, and monitoring memory usage for different input configurations. This approach highlights differences in performance, particularly as input size increases, and how each algorithm handles ordered and random data.
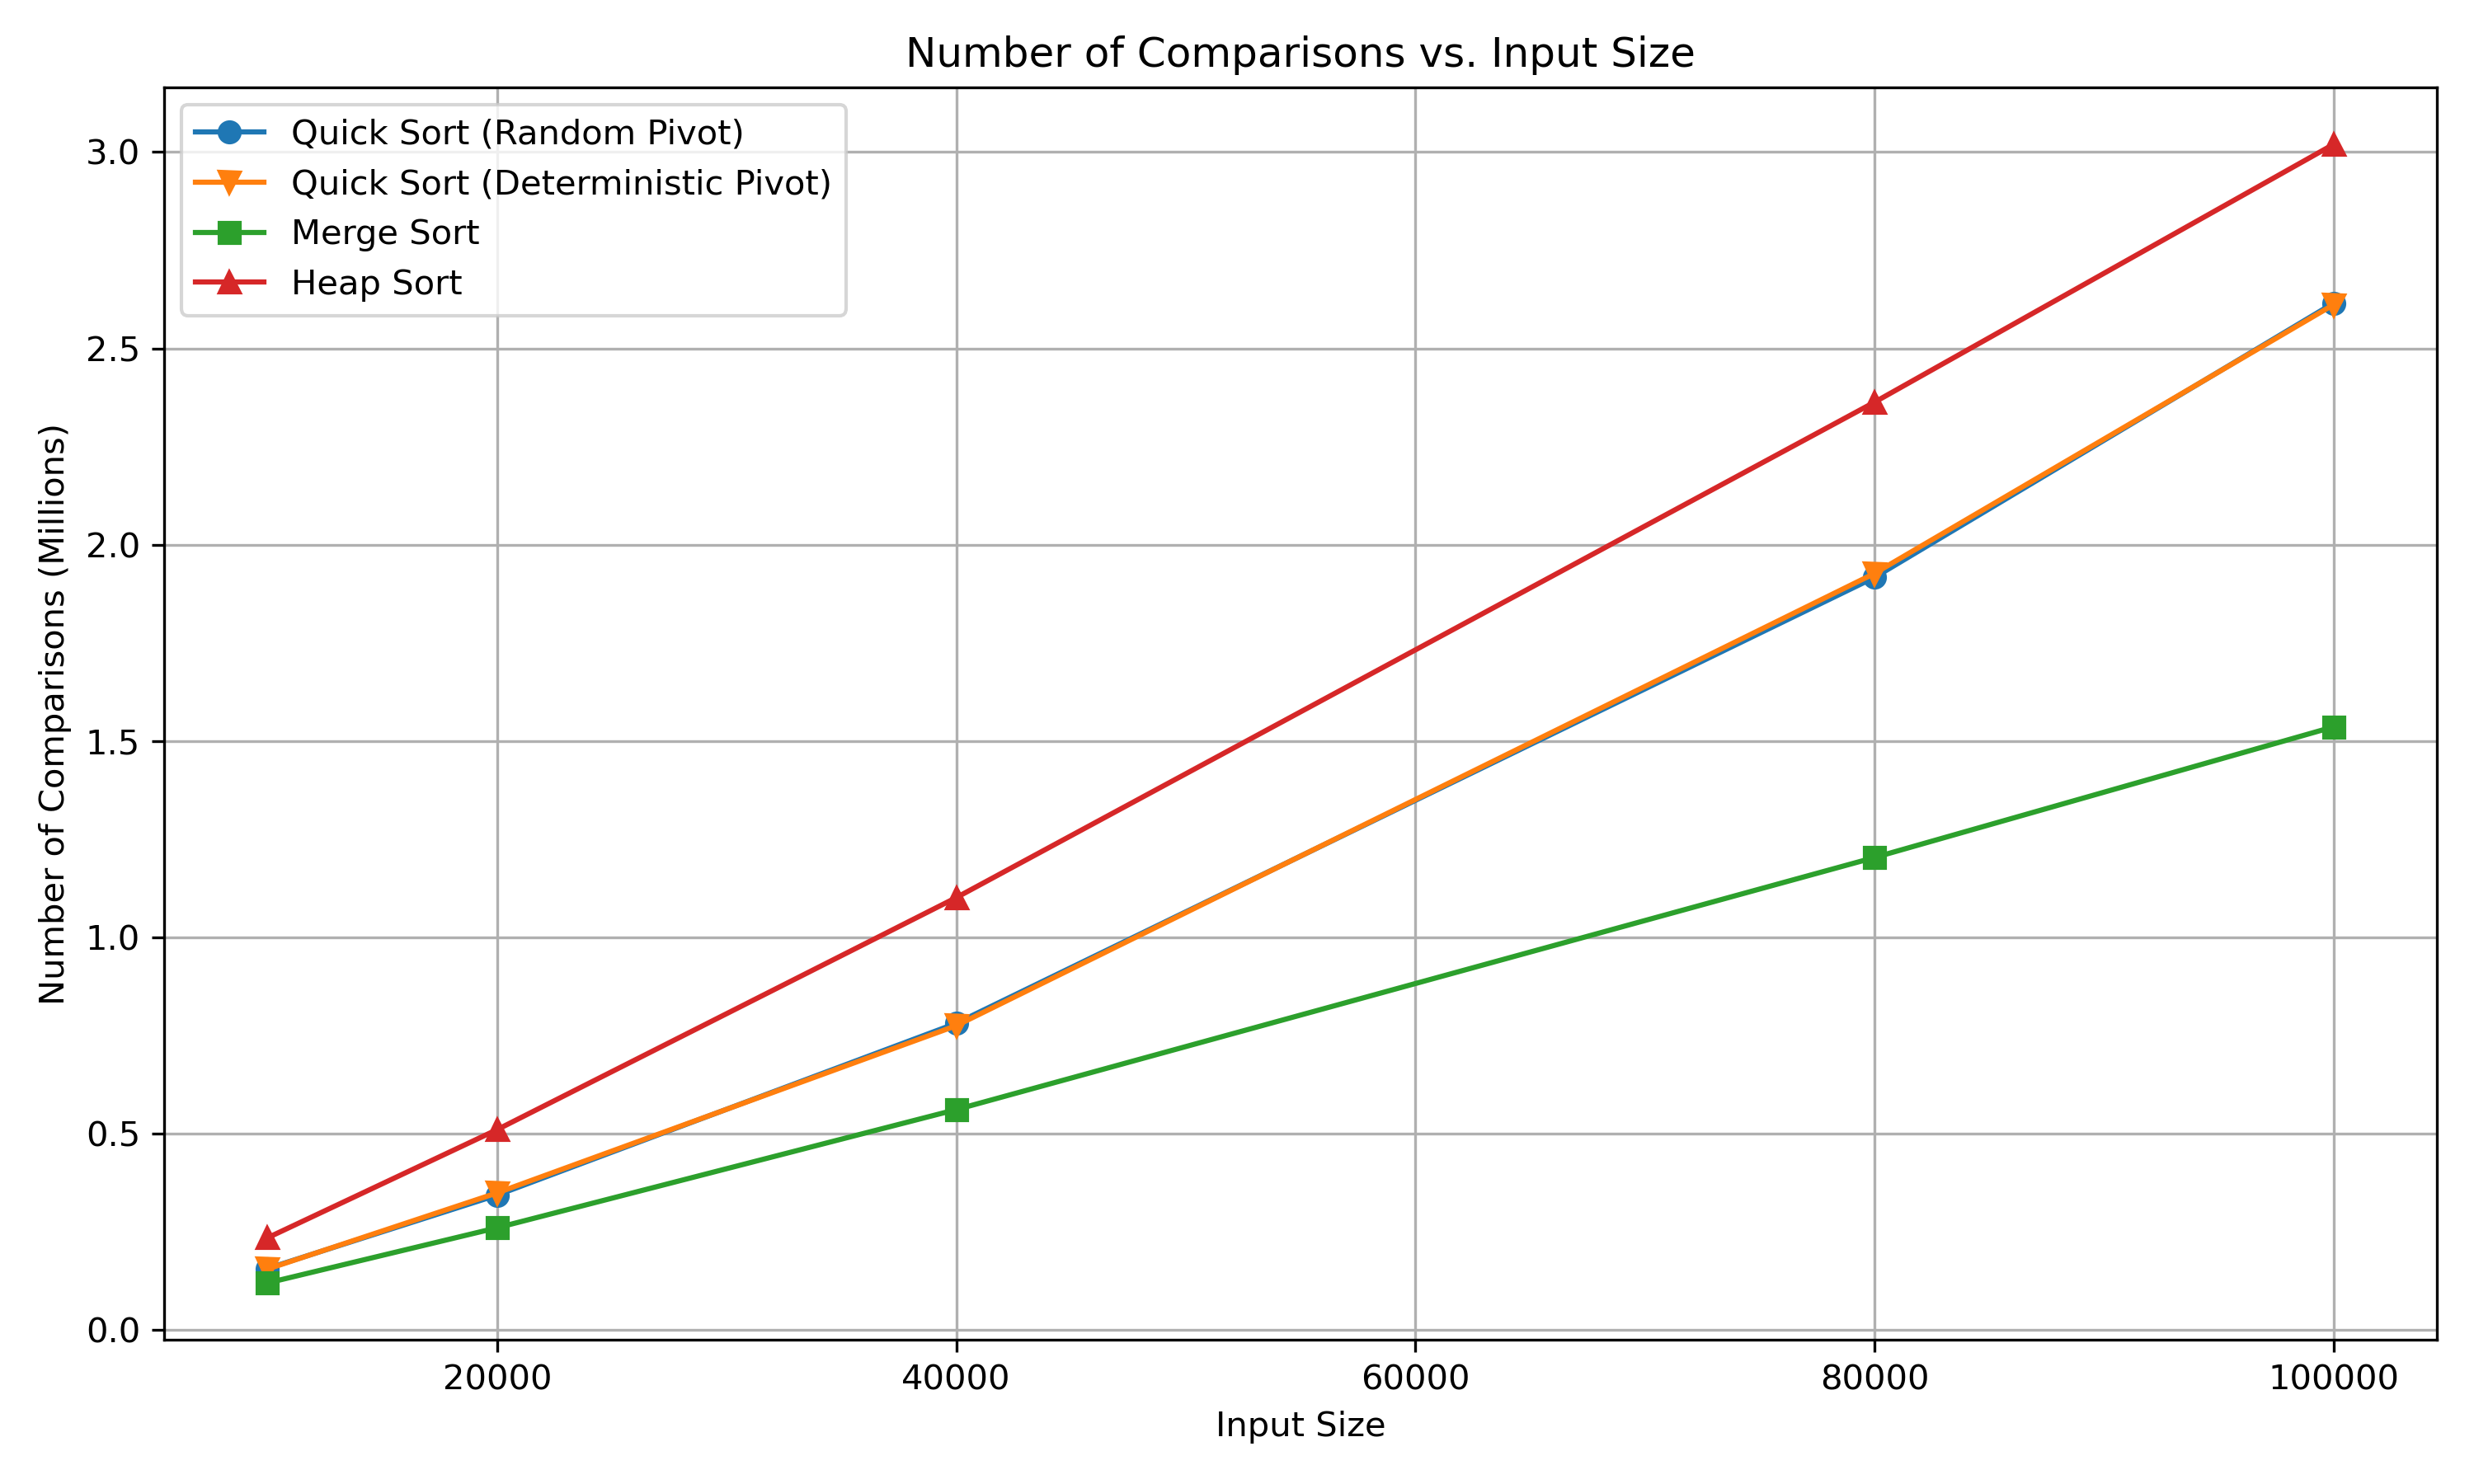
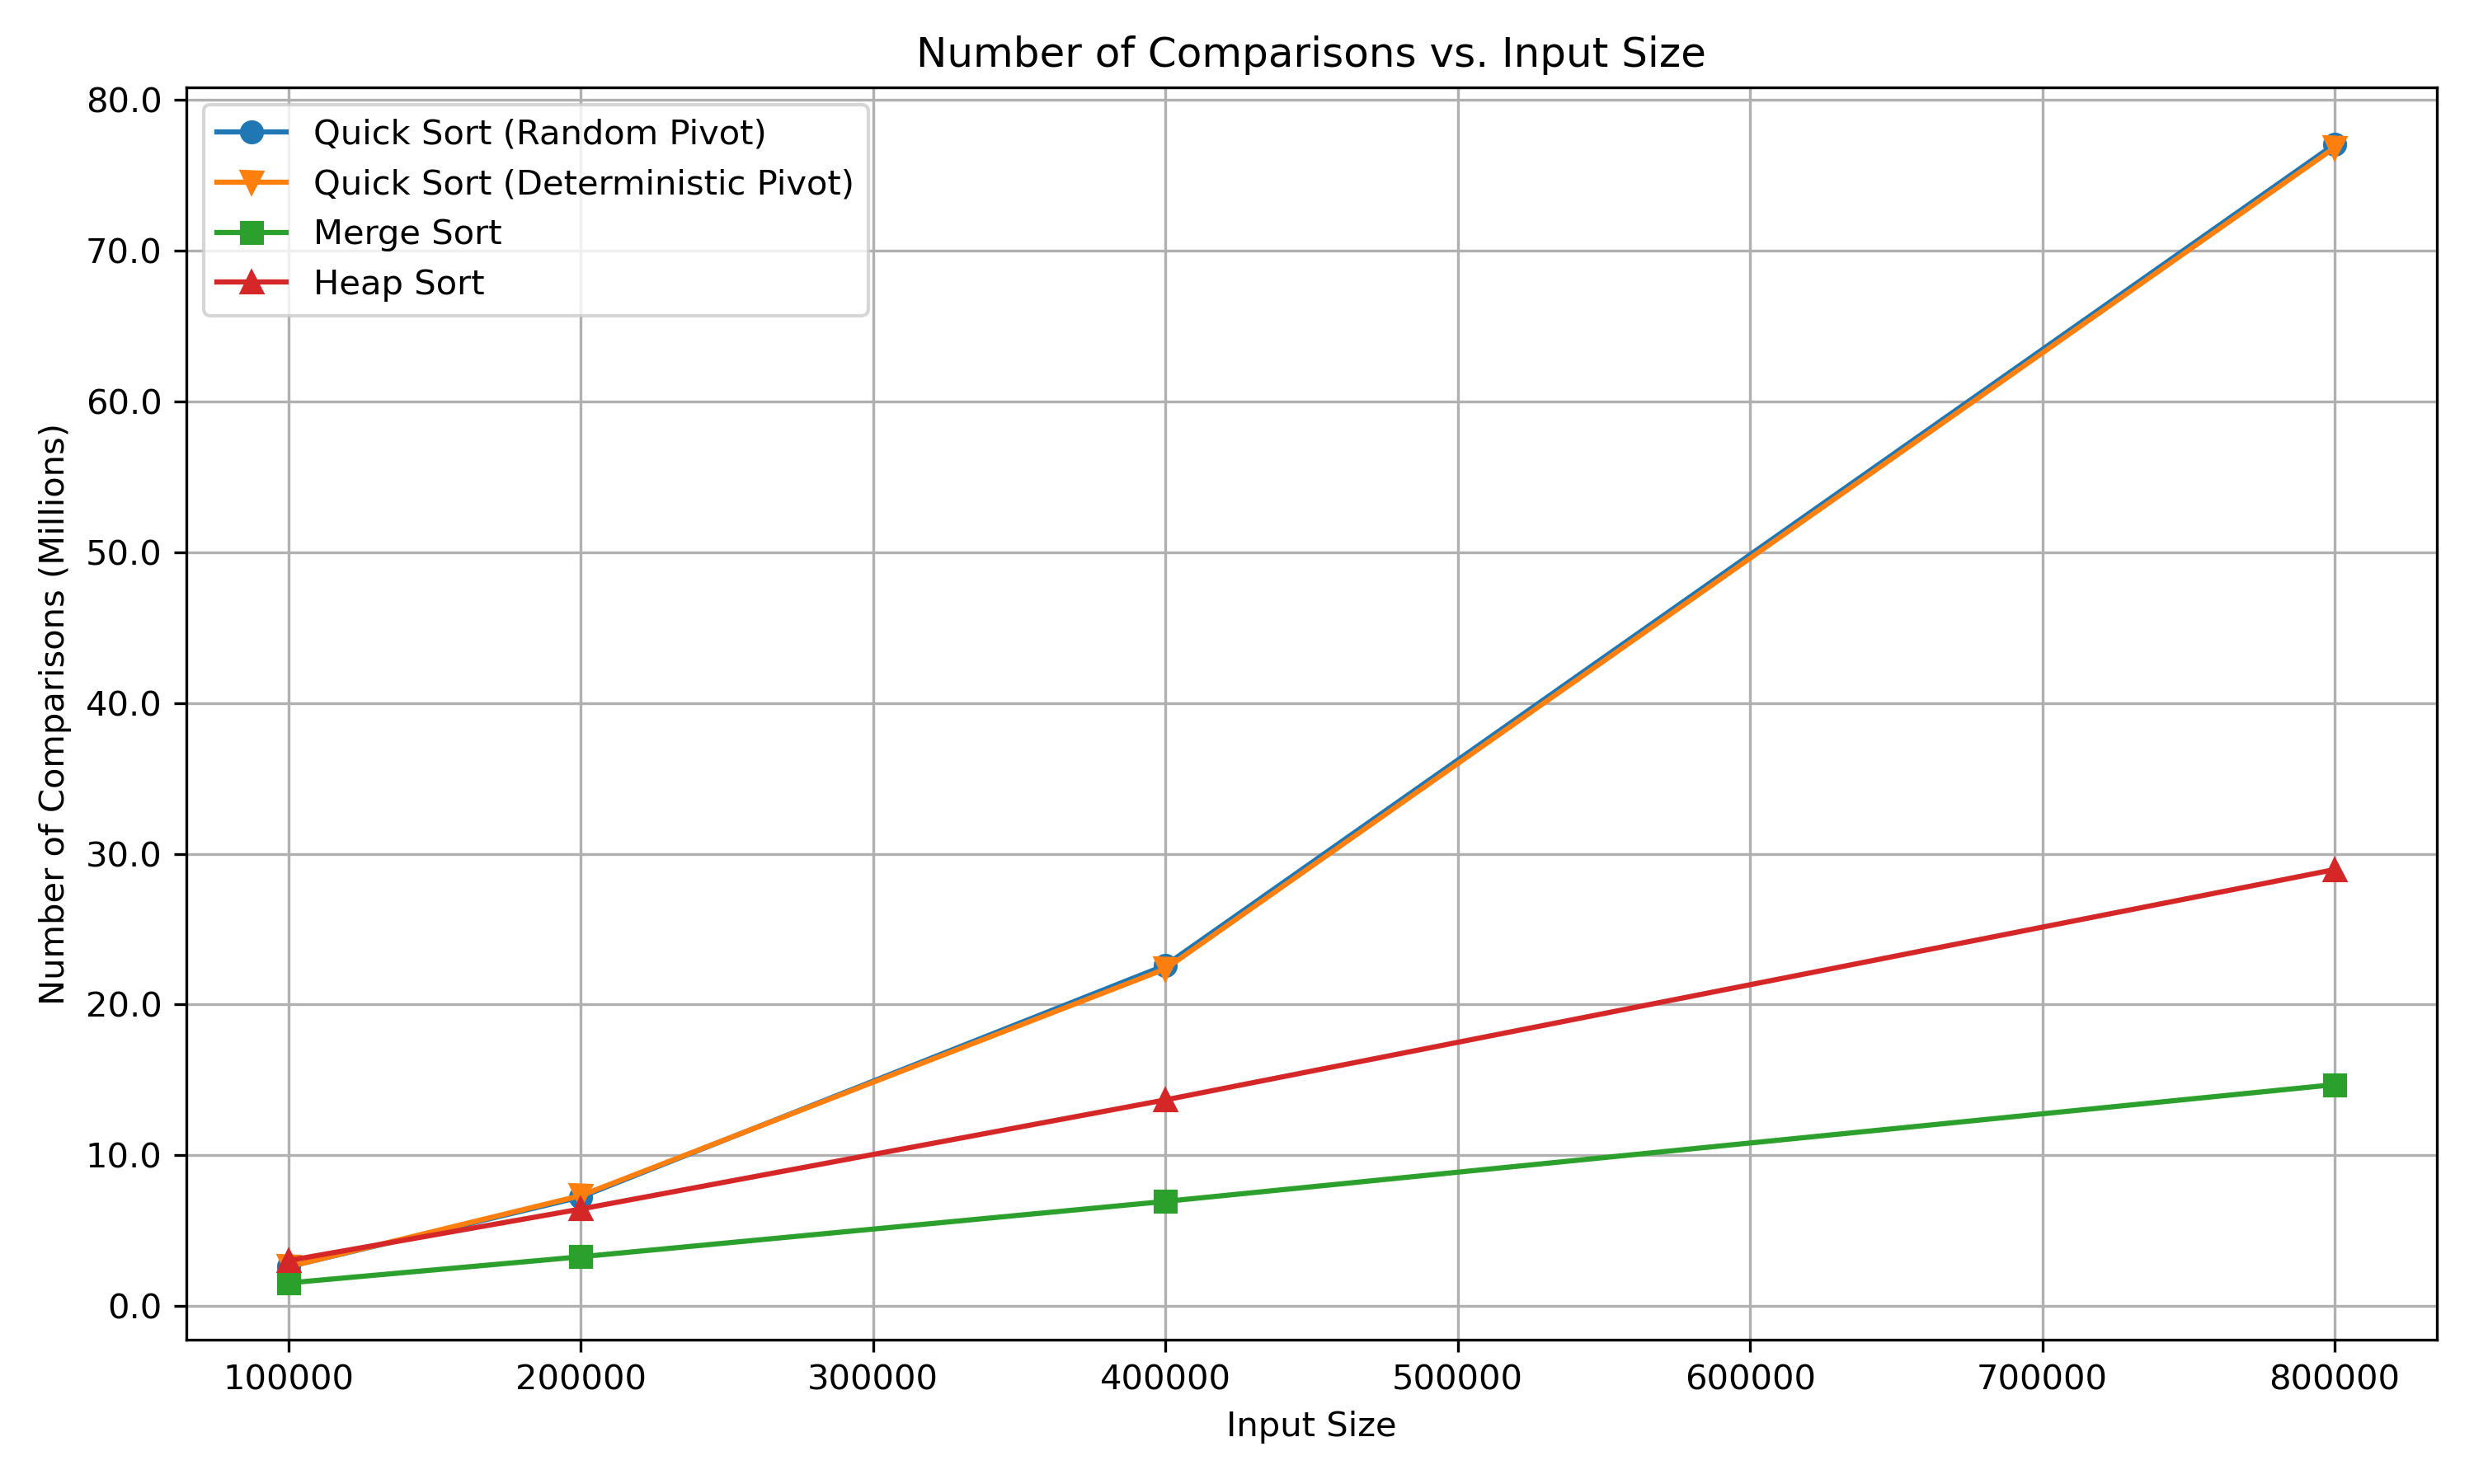
The performance evaluation is visualized through detailed comparison tables and graphical plots showing how the number of comparisons scales with input size. The final results provide insight into how the empirical data matches the worst-case time complexities of each algorithm.
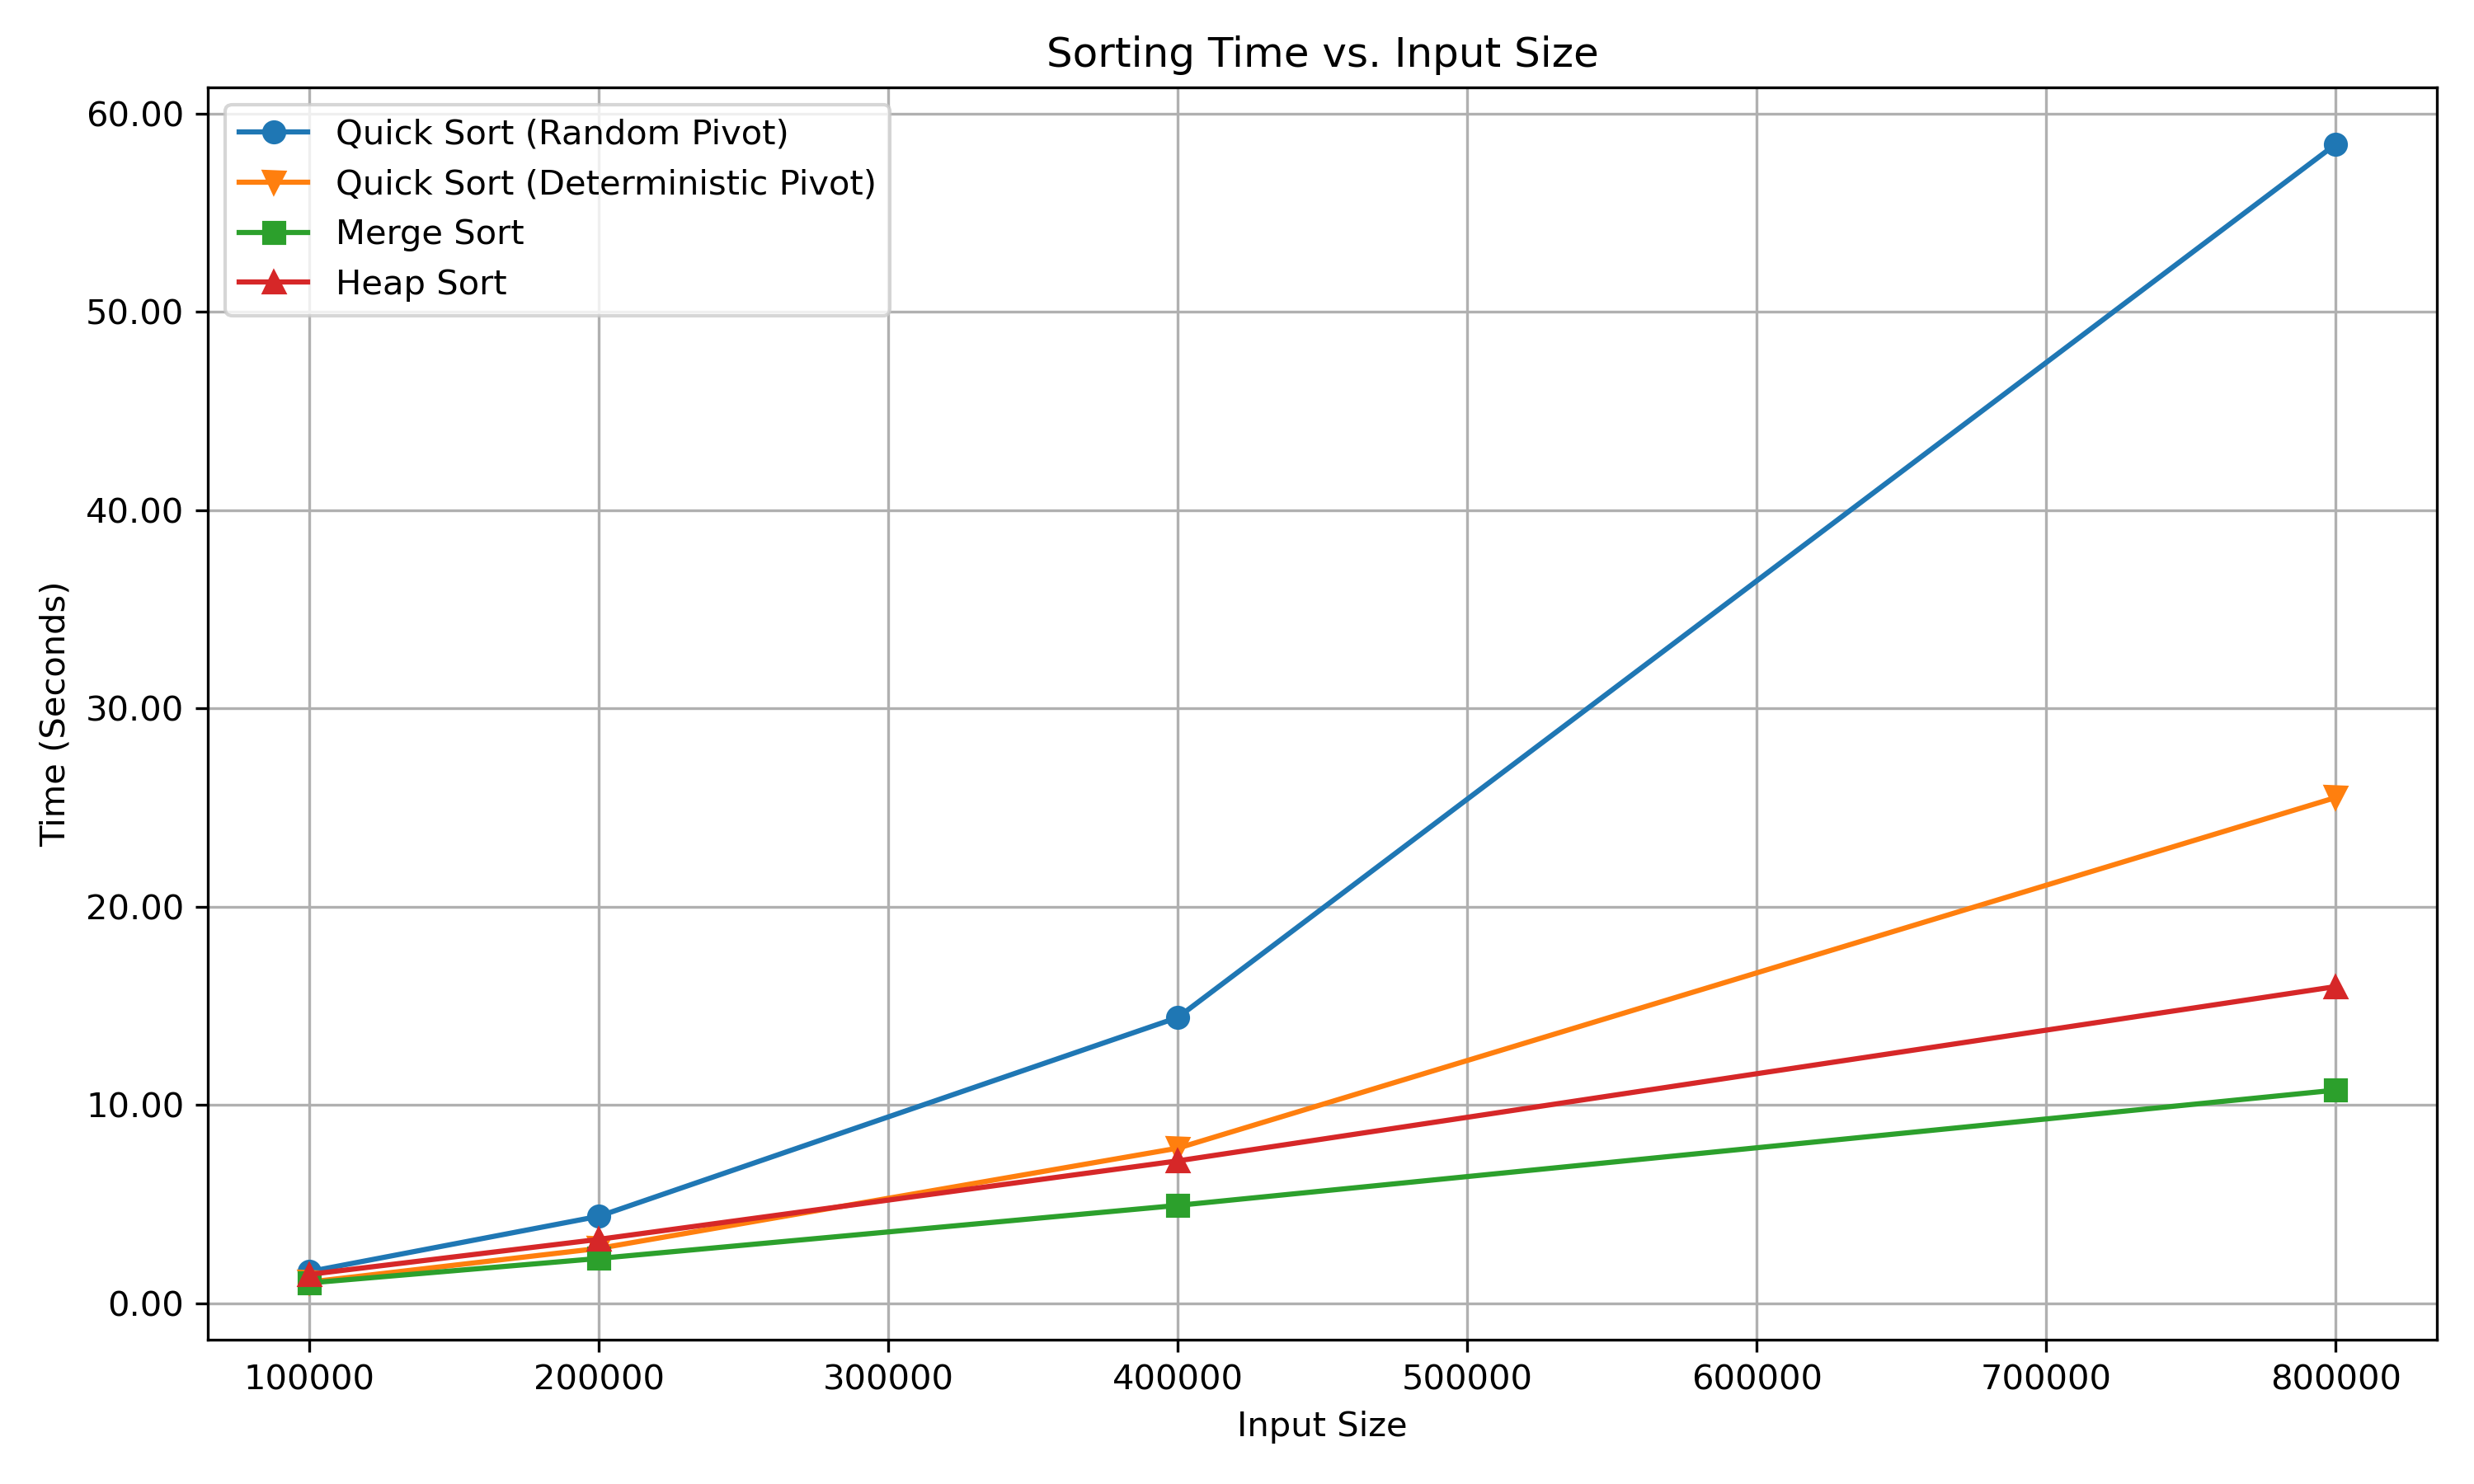
Machine-Dependent Time Graph
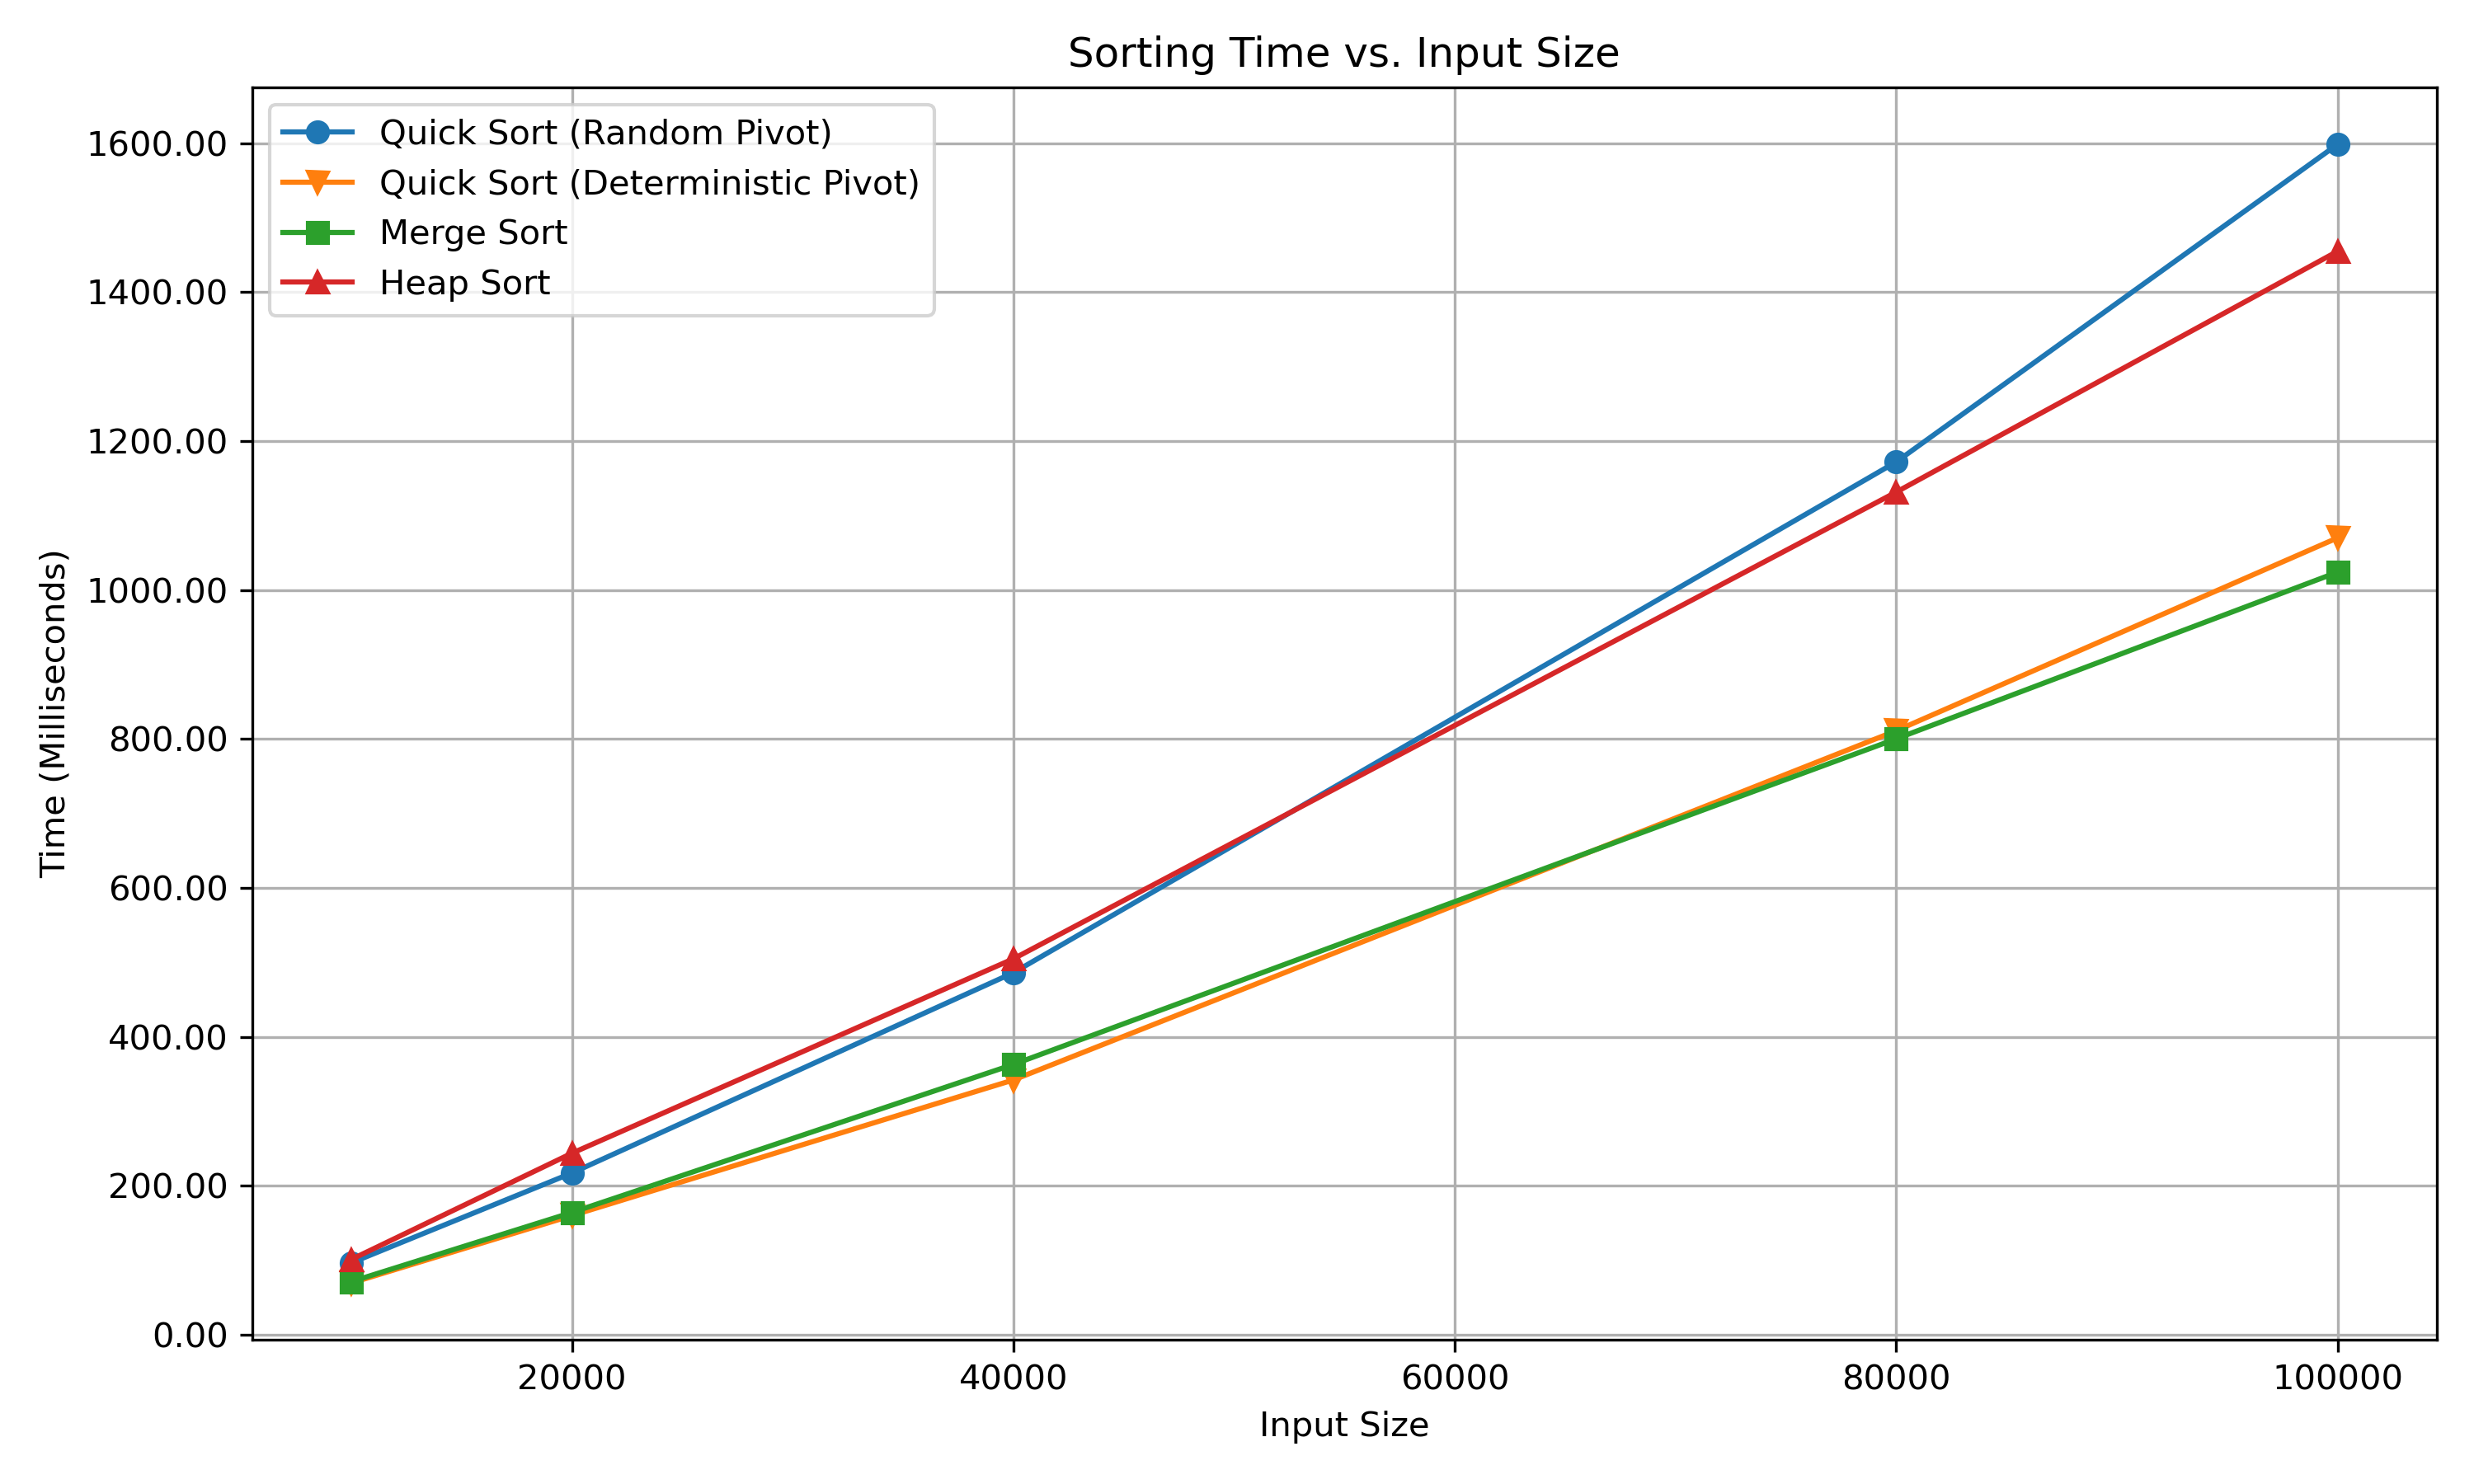
While the number of comparisons is the most reliable metric for measuring an algorithm’s performance, a machine-dependent time graph is also generated for perspective purposes. This graph measures the execution time of each algorithm in seconds on the specific machine used for testing, providing additional context for performance on a particular hardware setup. However, note that these times can vary significantly based on the hardware, so they are not generalizable across different systems.
Note: The running time reported for each sorting algorithm excludes time spent on dataset generation, dataset copying, or any other overhead operations. The measurement focuses solely on the algorithm execution time for fair and accurate benchmarking.
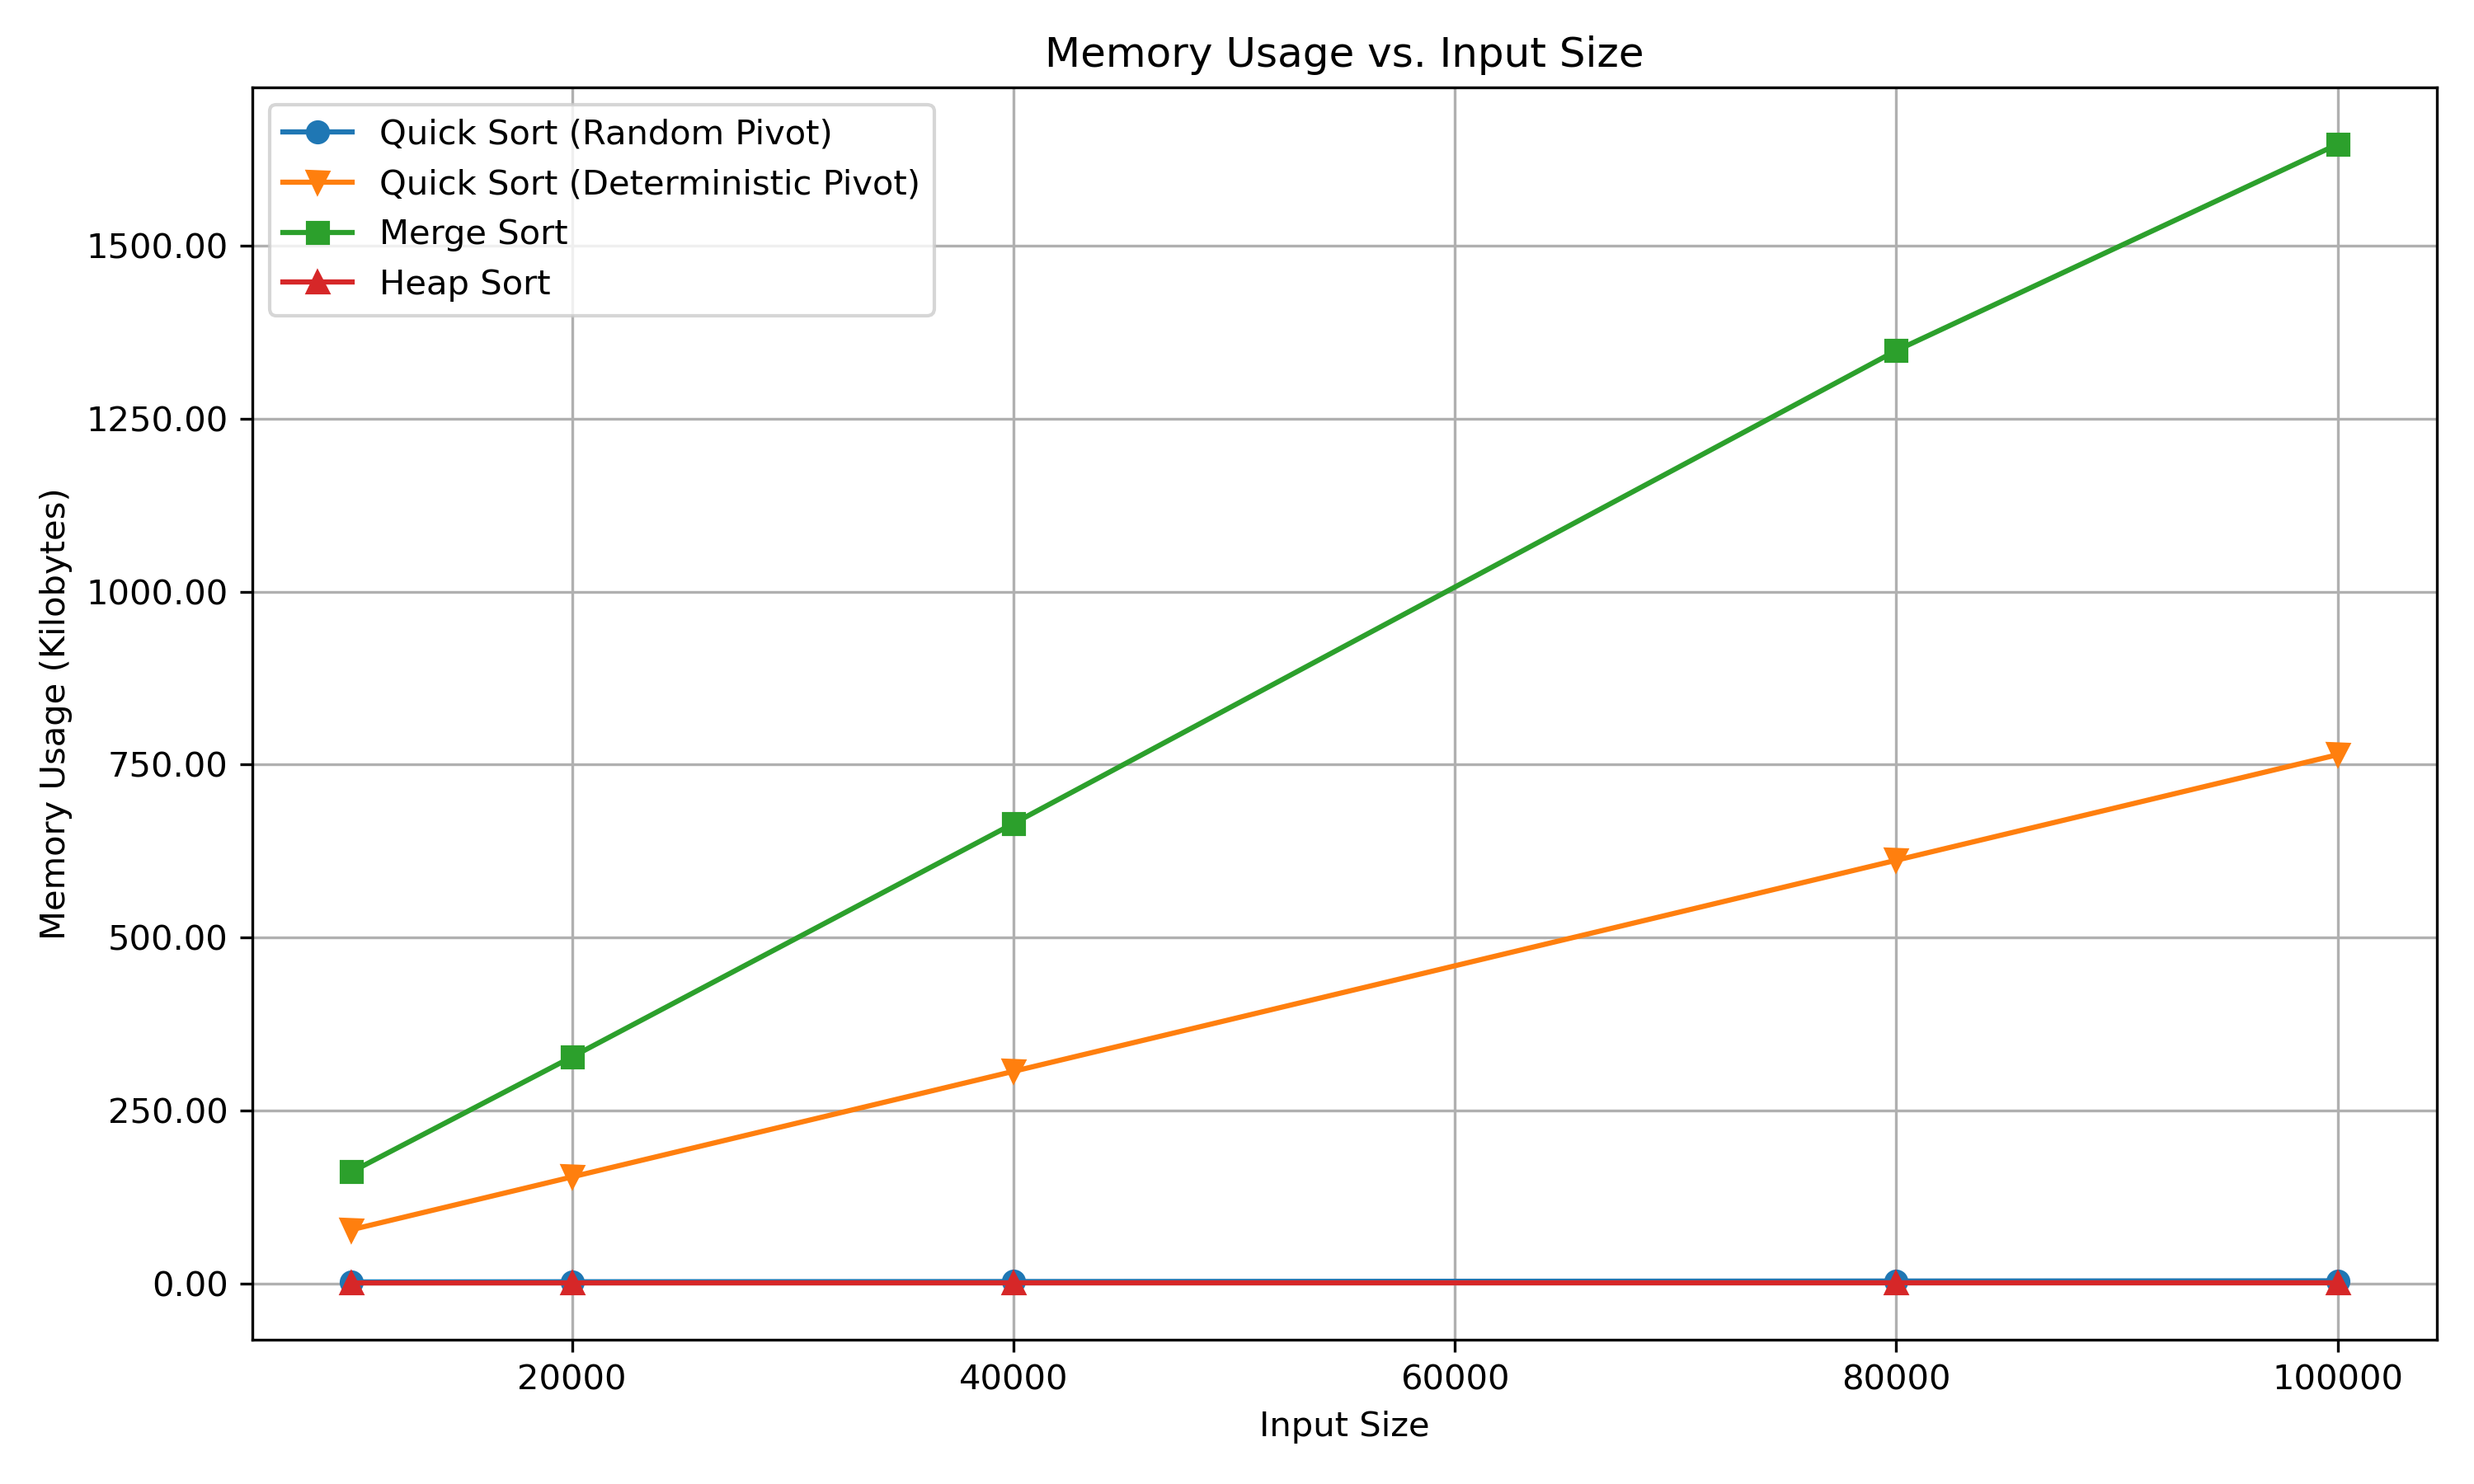
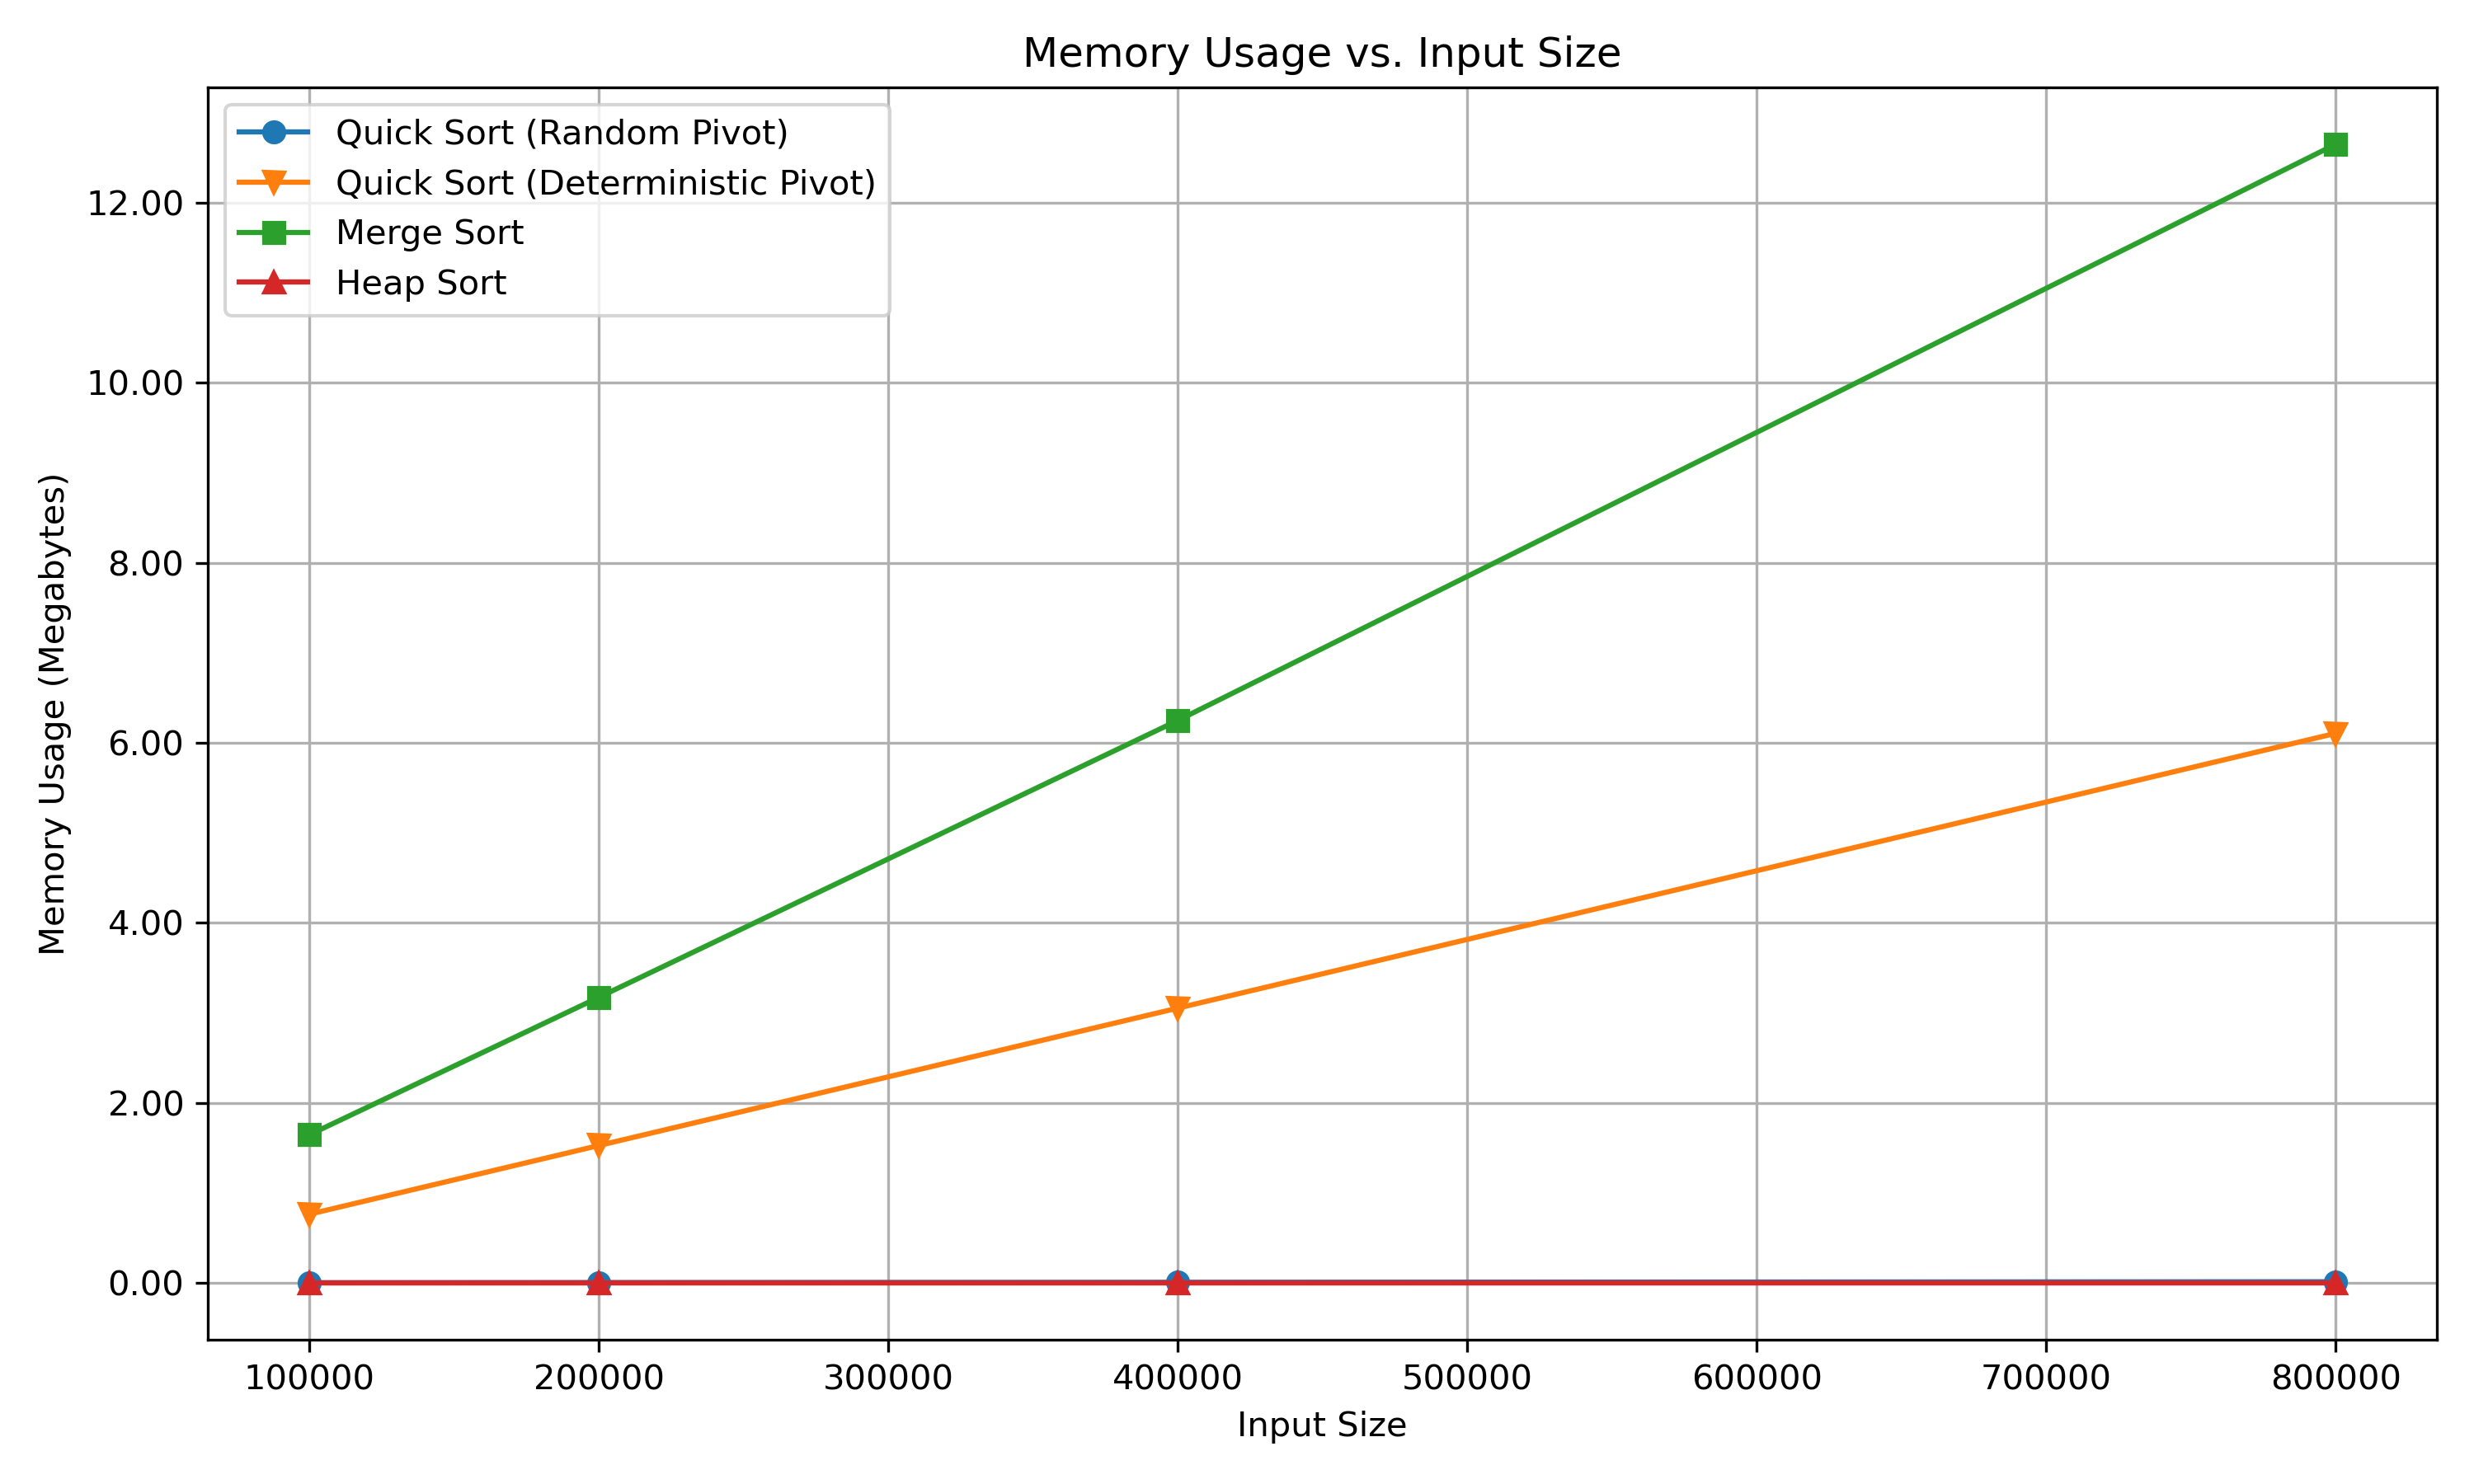
Disclaimer: The process of detecting memory usage (e.g., using tracemalloc) may introduce additional overhead to the execution time measurements. Despite this, all algorithms are subjected to the same memory detection process, ensuring that the relative performance comparisons remain valid. The actual data is proportional and relative to the number of comparisons made, maintaining fairness across all algorithms.
Algorithms Implemented
-
Quick Sort (Random Pivot): Uses random pivot selection to avoid worst-case scenarios in average cases.
-
Quick Sort (Deterministic Pivot): Uses the last element as the pivot. This version is implemented iteratively to handle large datasets without exceeding recursion limits.
-
Merge Sort: A classic divide-and-conquer sorting algorithm with O(n log n) time complexity.
-
Heap Sort: An in-place sorting algorithm based on the heap data structure.
Results and Report
Full Sorting Results
- Full Sorting Results (Markdown) Detailed empirical comparison of all algorithms across multiple dataset sizes.
Final Report
- Final Report (PDF) Full analysis and comparison of the sorting algorithms, including discussion of empirical and theoretical complexities.
Comparison Table
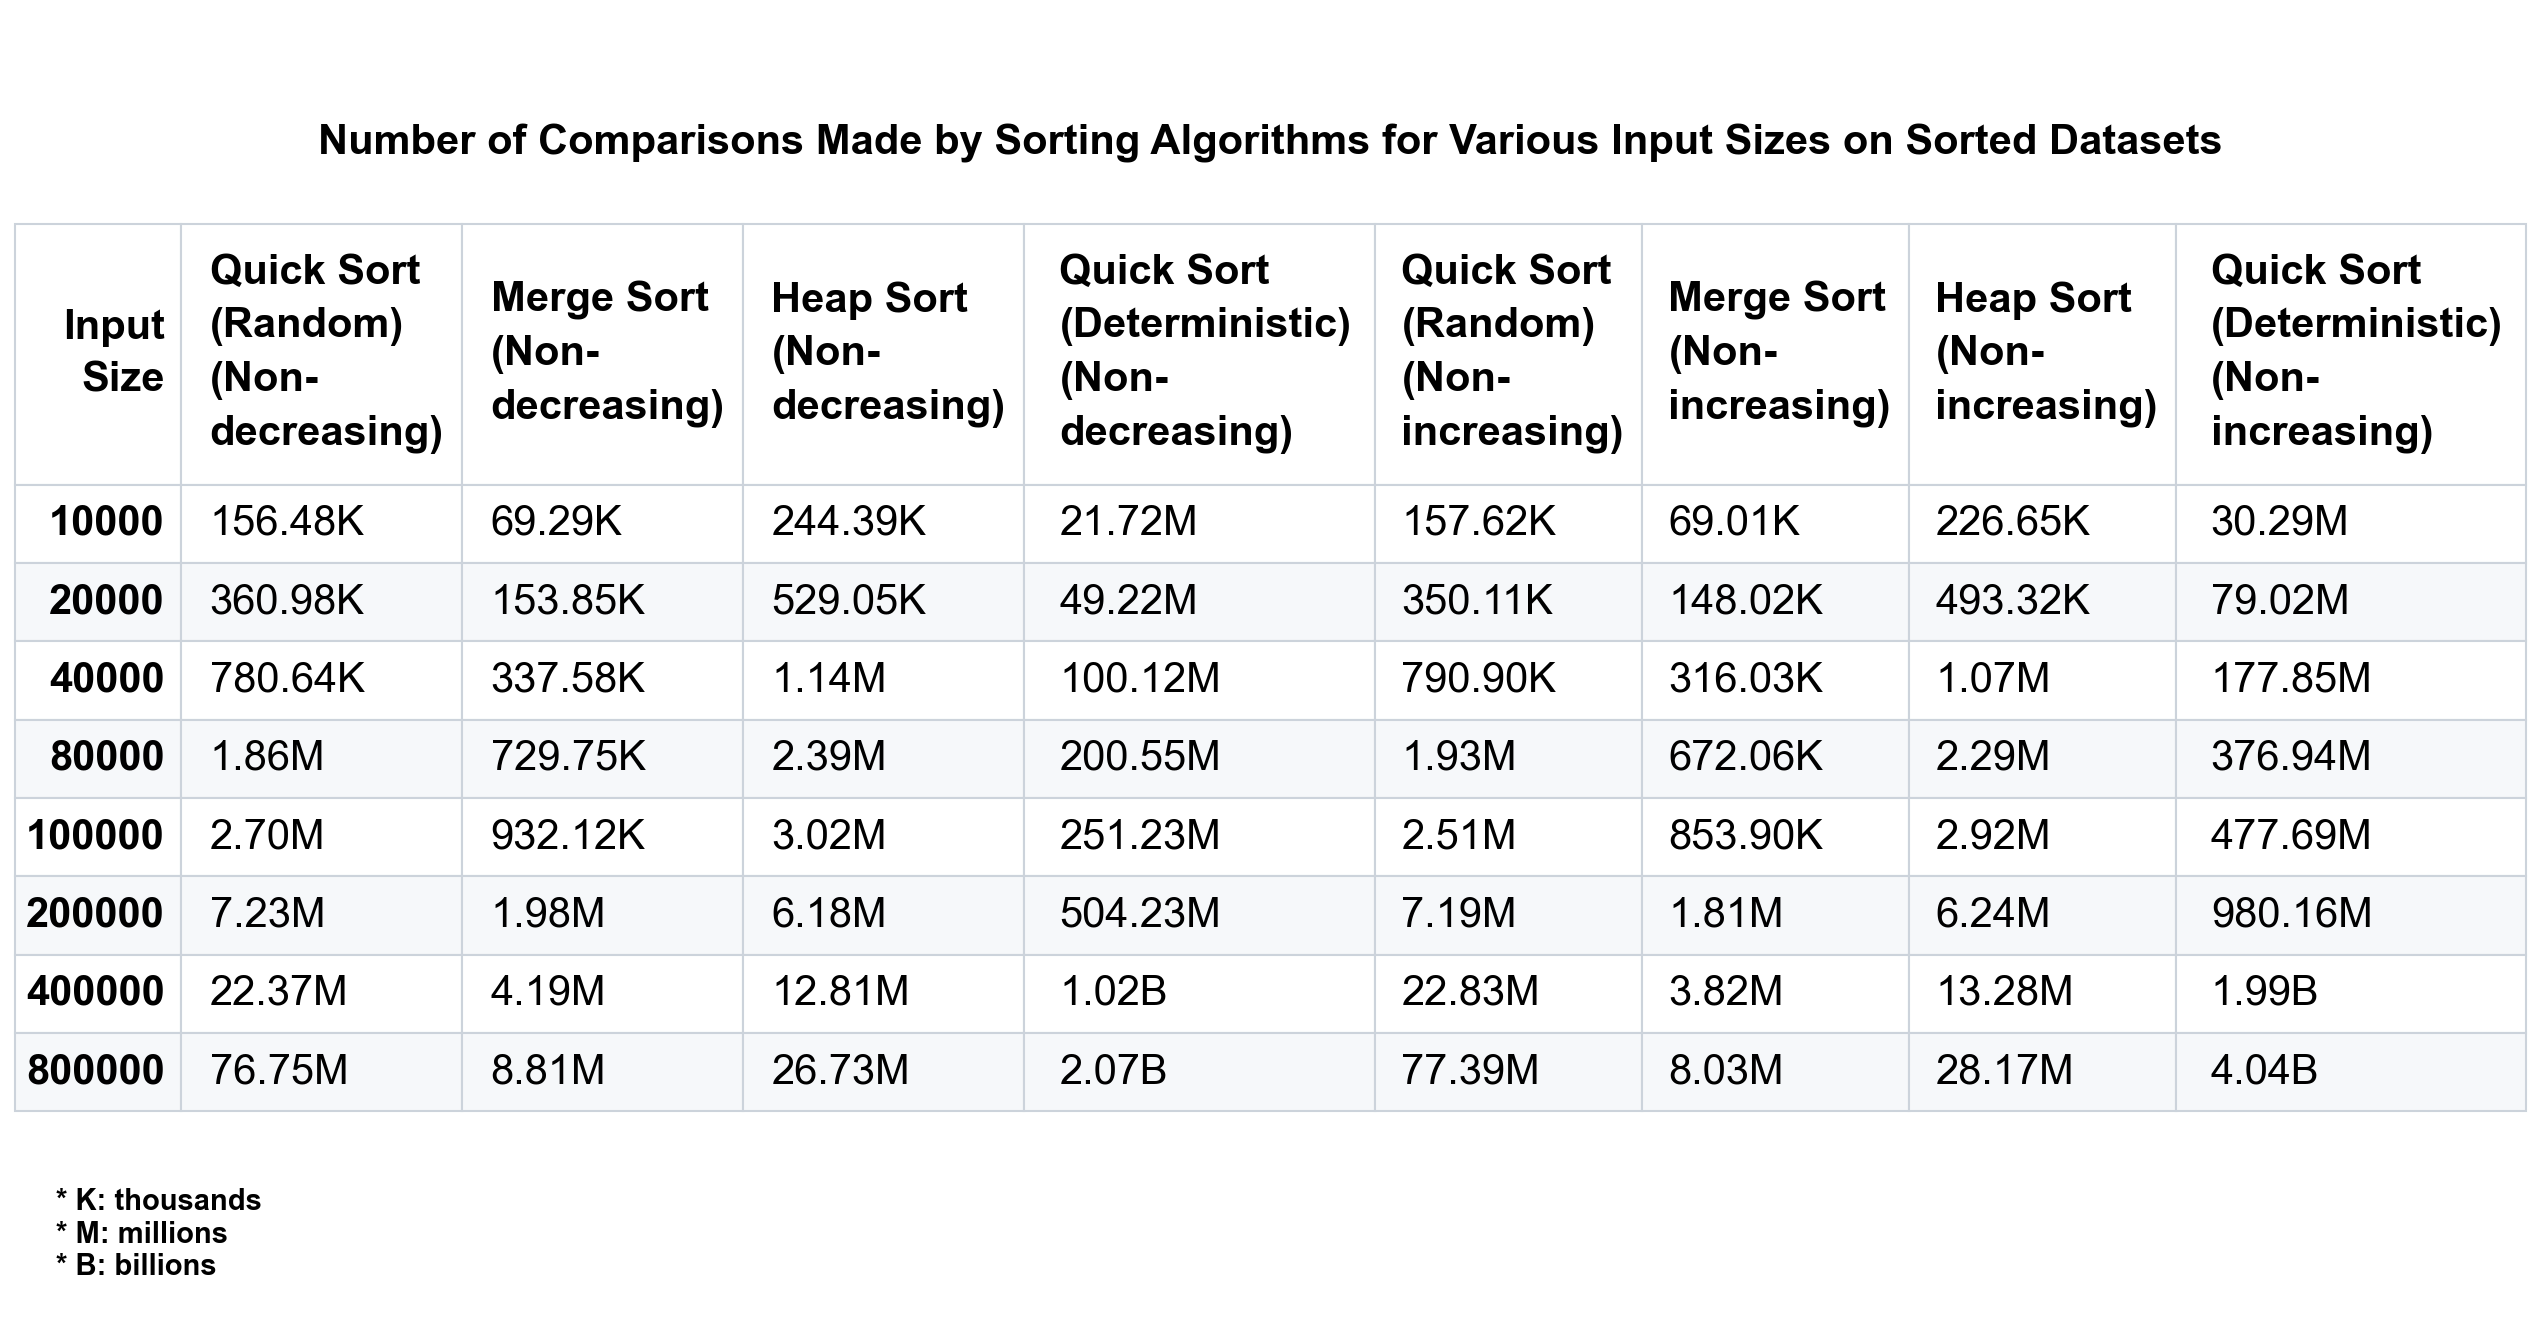
Below is the comparison table summarizing the number of comparisons made by each algorithm on non-decreasing and non-increasing datasets:
Plots
Number of Comparisons vs Input Size
-
Input Sizes 10,000 to 100,000
-
Input Sizes 100,000 to 800,000
Execution Time vs Input Size
-
Input Sizes 10,000 to 100,000
-
Input Sizes 100,000 to 800,000
Memory Usage vs Input Size
-
Input Sizes 10,000 to 100,000
-
Input Sizes 100,000 to 800,000
Requirements
To run the project and generate the plots and tables, you need to install the following Python packages:
- numpy
- matplotlib
- pandas
- tabulate
You can install them using the following command:
conda env create -f environment.yml
Project Structure
./
│
├── data/                          # Contains generated datasets for different input sizes
│   ├── size_10000/
│   │   ├── input_1.txt
│   │   ├── input_2.txt
│   │   └── ...
│   ├── size_20000/
│   ├── ...
│   └── size_800000/
│
├── report/
│   └── report.pdf                 # Final report
│
├── results/                       # Contains results data and comparison plots
│   ├── comparison_table.md               # Table of sorted results for non-decreasing and non-increasing datasets
│   ├── comparison_table.png              # PNG image of the comparison table
│   ├── comparisons_10000_to_100000.png   # Plot of comparisons for input sizes 10,000 to 100,000
│   ├── comparisons_100000_to_800000.png  # Plot of comparisons for input sizes 100,000 to 800,000
│   ├── memory_10000_to_100000.png        # Plot of memory usage for input sizes 10,000 to 100,000
│   ├── memory_100000_to_800000.png       # Plot of memory usage for input sizes 100,000 to 800,000
│   ├── time_10000_to_100000.png          # Plot of times for input sizes 10,000 to 100,000
│   ├── time_100000_to_800000.png         # Plot of times for input sizes 100,000 to 800,000
│   ├── plot_data.csv                     # CSV data for plotting comparisons and times
│   ├── table_data.csv                    # CSV data for table of sorted comparisons
│   └── sorting_results.md                # Markdown report of the sorting comparisons and timings
│
├── src/
│   ├── generate_datasets.py       # Script to generate random datasets
│   ├── sorting_algorithms.py      # Sorting algorithms (Quick Sort, Merge Sort, Heap Sort)
│   ├── main.py                    # Main script to run sorting and collect comparison data
│   ├── plotting_script.py         # Script to generate plots from comparison data
│   └── table_script.py            # Script to generate tables from comparison data
│
├── tests/                         # Test files for sorting algorithms on different input types
│
├── README.md
└── environment.yml               # Python environment dependencies