RMSynthesis.ipynb
from matplotlib import pyplot as plt
import numpy as np
from astropy.io import fits
import healpy as hp
from healpy.newvisufunc import projview, newprojplot
from astropy.wcs import WCS
import matplotlib.colors as mcolors
original_cmap = plt.get_cmap('Set1')

colors = original_cmap(np.arange(1,6,1))
Set11 = mcolors.ListedColormap(colors)
fn = '/srv/data/dragons/dragons-canfar-Nov2025/faraday_synthesis/dragons_Npeaks_8sigma.hpx.fits'
eightsigmapeaksdat = fits.getdata(fn)
eightsigmapeakdshdr = fits.getheader(fn)
fn1 = '/srv/data/dragons/dragons-canfar-Nov2025/faraday_synthesis/dragons_Npeaks_8sigma.car.fits'
eightsigmapeakscardat = fits.getdata(fn1)
eightsigmapeakscarhdr = fits.getheader(fn1)
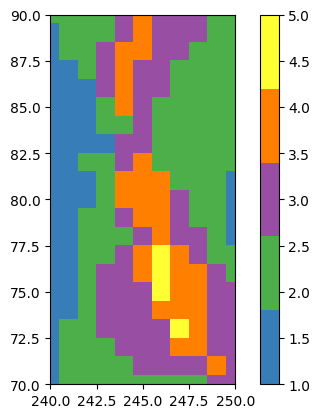
fig, ax = plt.subplots(1,1)
im = ax.imshow(eightsigmapeakscardat,
               cmap = Set11, vmin =1, vmax = 5,
               origin = 'lower'
              )
plt.colorbar(im)
ax.set_xlim(240,250)
ax.set_ylim(70,90)
(70.0, 90.0)
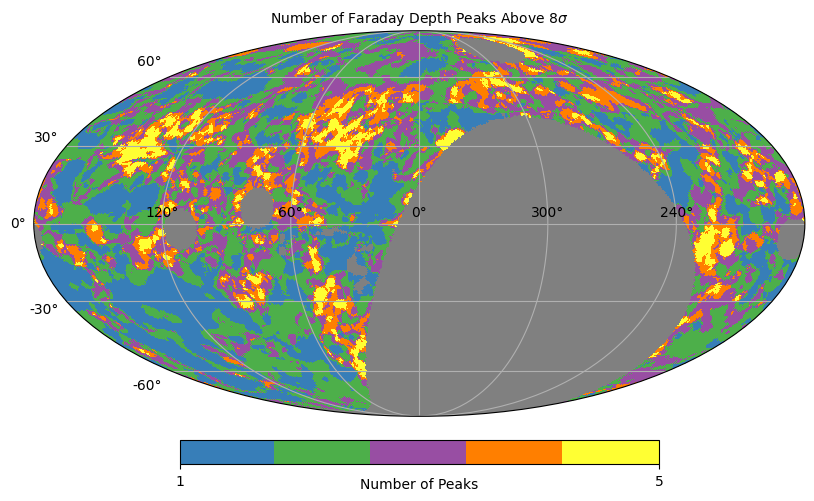
projview(
    eightsigmapeaksdat,
    projection_type = 'mollweide',
    graticule = True,
    graticule_labels=True,
    # xlabel="Longitude",
    # ylabel="Latitude",
    cb_orientation = "horizontal",
    cmap = Set11,
    min = 1,
    max = 5,
    unit = r'Number of Peaks',
    title = r'Number of Faraday Depth Peaks Above 8$\sigma$',
    fontsize={
    "title":10,
    "xtick_label":10,
    "ytick_label":10,
    "cbar_label":10
    }
    )
<matplotlib.collections.QuadMesh at 0x7f2078cf77d0>
fn = '/srv/data/dragons/dragons-canfar-Nov2025/faraday_synthesis/dragons_Npeaks_8sigma.car.fits'
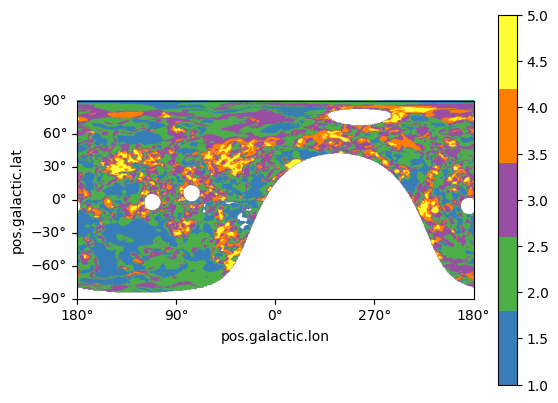
Npeakscardat = fits.getdata(fn)
Npeakscarhdr = fits.getheader(fn)
fig, ax = plt.subplots(1,1, subplot_kw={'projection': wcs.celestial})
im0 = ax.imshow(Npeakscardat, origin='lower', cmap = Set11, vmin=1, vmax=5)
plt.colorbar(im0)
plt.show()
#loading clean Faraday Depth Cube for spectra from DRAGONS
fn = '/srv/data/dragons/dragons-canfar-Nov2025/faraday_synthesis/dragons_FDF_clean_tot_Kgal.car.fits'
FDcleandat = fits.getdata(fn)
FDcleanhdr = fits.getheader(fn)
#loading dirty Faraday Depth Cube for spectra
fn = '/srv/data/dragons/dragons-canfar-Nov2025/faraday_synthesis/dragons_FDF_tot_dirty_Kgal.car.fits'
FDdirtydat = fits.getdata(fn)
FDdirtyhdr = fits.getheader(fn)
wcs = WCS(FDcleanhdr)
wcs
WCS Keywords

Number of WCS axes: 3
CTYPE : 'GLON-CAR' 'GLAT-CAR' 'FDEP'
CRVAL : 0.0 0.0 0.0
CRPIX : 360.5 180.5 401.0
PC1_1 PC1_2 PC1_3  : 1.0 0.0 0.0
PC2_1 PC2_2 PC2_3  : 0.0 1.0 0.0
PC3_1 PC3_2 PC3_3  : 0.0 0.0 1.0
CDELT : -0.5 0.5 0.5
NAXIS : 720  360  801
FDcleanhdr
SIMPLE  =                    T / conforms to FITS standard
BITPIX  =                  -64 / array data type
NAXIS   =                    3 / number of array dimensions
NAXIS1  =                  720
NAXIS2  =                  360
NAXIS3  =                  801
COORDSYS= 'Galactic '          / Ecliptic, Galactic or Celestial (equatorial)
CRPIX2  =                180.5
CDELT2  =                  0.5
CUNIT2  = 'deg     '
BUNIT   = 'K/RMSF  '
CTYPE2  = 'GLAT-CAR'
CRVAL2  =                    0
CTYPE3  = 'FDEP    '           / Faraday depth (linear)
CRPIX3  =                  401
CRVAL3  =                  0.0 / [rad/m^2] Coordinate value at reference point
CDELT3  =                  0.5 / [rad/m^2] Coordinate increment at reference poi
CUNIT3  = 'rad/m^2 '
CTYPE1  = 'GLON-CAR'
CRPIX1  =                360.5
CRVAL1  =                    0
CDELT1  =                 -0.5
CUNIT1  = 'deg     '
INSTRUME= 'DRAO-15 '
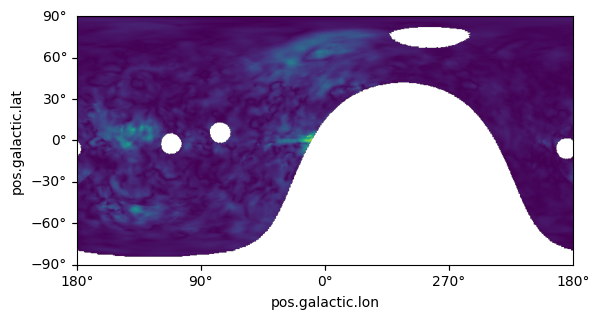
fig, ax = plt.subplots(1,1, subplot_kw={'projection': wcs.celestial})
im0 = ax.imshow(FDcleandat[100], origin='lower')
plt.show()
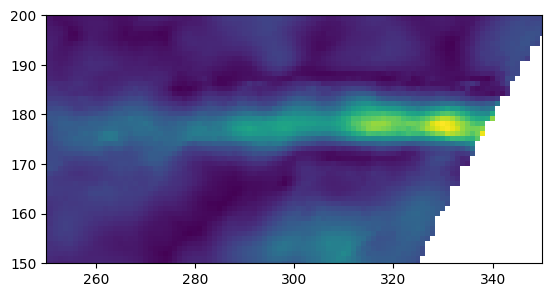
fig, ax = plt.subplots(1,1)
im1 = ax.imshow(FDcleandat[216], origin='lower')
ax.set_ylim(150,200)
ax.set_xlim(250, 350)
plt.show()
# ax.set_xlim(50, 100)
# ax.set_ylim(160, 210)
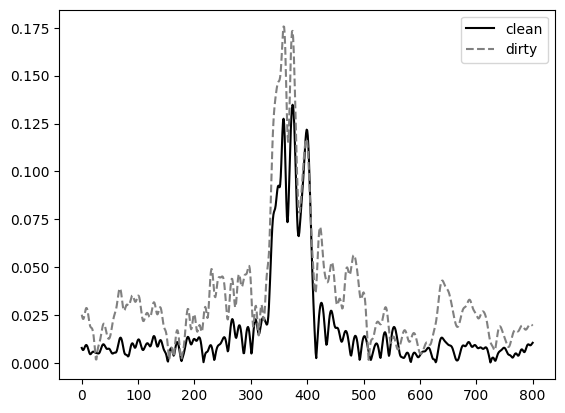
x = 246
y = 75
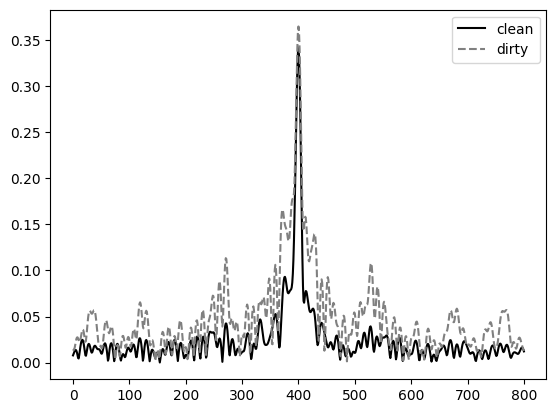
cleanspectra = FDcleandat[:, x, y]
dirtyspectra = FDdirtydat[:, x, y]
fig, axs = plt.subplots()
axs.plot(cleanspectra, label = 'clean', color = 'black')
axs.plot(dirtyspectra, label = 'dirty', linestyle = 'dashed', color = 'grey')
plt.legend()
ax.set_title('Faraday Depth Spectra of
<matplotlib.legend.Legend at 0x7f2075dd2510>
x = 83
y = 198
cleanspectra = FDcleandat[:, x, y]
dirtyspectra = FDdirtydat[:, x, y]
fig, axs = plt.subplots()
axs.plot(cleanspectra, label = 'clean', color = 'black')
axs.plot(dirtyspectra, label = 'dirty', linestyle = 'dashed', color = 'grey')
plt.legend()
<matplotlib.legend.Legend at 0x7f2075c52510>