
Data Normalization Techniques
Estimated time needed: 30 minutes
In this lab, you will focus on data normalization. This includes identifying compensation-related columns, applying normalization techniques, and visualizing the data distributions.
Objectives
In this lab, you will perform the following:
-
Identify duplicate rows and remove them.
-
Check and handle missing values in key columns.
-
Identify and normalize compensation-related columns.
-
Visualize the effect of normalization techniques on data distributions.
Hands on Lab
Step 1: Install and Import Libraries
!pip install pandas
Requirement already satisfied: pandas in /opt/conda/lib/python3.12/site-packages (3.0.0)
Requirement already satisfied: numpy>=1.26.0 in /opt/conda/lib/python3.12/site-packages (from pandas) (2.4.1)
Requirement already satisfied: python-dateutil>=2.8.2 in /opt/conda/lib/python3.12/site-packages (from pandas) (2.9.0.post0)
Requirement already satisfied: six>=1.5 in /opt/conda/lib/python3.12/site-packages (from python-dateutil>=2.8.2->pandas) (1.17.0)
!pip install matplotlib
Requirement already satisfied: matplotlib in /opt/conda/lib/python3.12/site-packages (3.10.8)
Requirement already satisfied: contourpy>=1.0.1 in /opt/conda/lib/python3.12/site-packages (from matplotlib) (1.3.3)
Requirement already satisfied: cycler>=0.10 in /opt/conda/lib/python3.12/site-packages (from matplotlib) (0.12.1)
Requirement already satisfied: fonttools>=4.22.0 in /opt/conda/lib/python3.12/site-packages (from matplotlib) (4.61.1)
Requirement already satisfied: kiwisolver>=1.3.1 in /opt/conda/lib/python3.12/site-packages (from matplotlib) (1.4.9)
Requirement already satisfied: numpy>=1.23 in /opt/conda/lib/python3.12/site-packages (from matplotlib) (2.4.1)
Requirement already satisfied: packaging>=20.0 in /opt/conda/lib/python3.12/site-packages (from matplotlib) (24.2)
Requirement already satisfied: pillow>=8 in /opt/conda/lib/python3.12/site-packages (from matplotlib) (12.1.0)
Requirement already satisfied: pyparsing>=3 in /opt/conda/lib/python3.12/site-packages (from matplotlib) (3.3.2)
Requirement already satisfied: python-dateutil>=2.7 in /opt/conda/lib/python3.12/site-packages (from matplotlib) (2.9.0.post0)
Requirement already satisfied: six>=1.5 in /opt/conda/lib/python3.12/site-packages (from python-dateutil>=2.7->matplotlib) (1.17.0)
import numpy as np
import pandas as pd
import matplotlib.pyplot as plt
Step 2: Load the Dataset into a DataFrame
We use the pandas.read_csv() function for reading CSV files. However, in this version of the lab, which operates on JupyterLite, the dataset needs to be downloaded to the interface using the provided code below.
The functions below will download the dataset into your browser:
file_path = "https://cf-courses-data.s3.us.cloud-object-storage.appdomain.cloud/n01PQ9pSmiRX6520flujwQ/survey-data.csv"

df = pd.read_csv(file_path)

# Display the first few rows to check if data is loaded correctly
print(df.head())
print('Initial dataframe:', df.shape)
   ResponseId                      MainBranch                 Age  \
0           1  I am a developer by profession  Under 18 years old
1           2  I am a developer by profession     35-44 years old
2           3  I am a developer by profession     45-54 years old
3           4           I am learning to code     18-24 years old
4           5  I am a developer by profession     18-24 years old

            Employment RemoteWork   Check  \
0  Employed, full-time     Remote  Apples
1  Employed, full-time     Remote  Apples
2  Employed, full-time     Remote  Apples
3   Student, full-time        NaN  Apples
4   Student, full-time        NaN  Apples

                                    CodingActivities  \
0                                              Hobby
1  Hobby;Contribute to open-source projects;Other...
2  Hobby;Contribute to open-source projects;Other...
3                                                NaN
4                                                NaN

                                             EdLevel  \
0                          Primary/elementary school
1       Bachelor’s degree (B.A., B.S., B.Eng., etc.)
2    Master’s degree (M.A., M.S., M.Eng., MBA, etc.)
3  Some college/university study without earning ...
4  Secondary school (e.g. American high school, G...

                                           LearnCode  \
0                             Books / Physical media
1  Books / Physical media;Colleague;On the job tr...
2  Books / Physical media;Colleague;On the job tr...
3  Other online resources (e.g., videos, blogs, f...
4  Other online resources (e.g., videos, blogs, f...

                                     LearnCodeOnline  ... JobSatPoints_6  \
0                                                NaN  ...            NaN
1  Technical documentation;Blogs;Books;Written Tu...  ...            0.0
2  Technical documentation;Blogs;Books;Written Tu...  ...            NaN
3  Stack Overflow;How-to videos;Interactive tutorial  ...            NaN
4  Technical documentation;Blogs;Written Tutorial...  ...            NaN

  JobSatPoints_7 JobSatPoints_8 JobSatPoints_9 JobSatPoints_10  \
0            NaN            NaN            NaN             NaN
1            0.0            0.0            0.0             0.0
2            NaN            NaN            NaN             NaN
3            NaN            NaN            NaN             NaN
4            NaN            NaN            NaN             NaN

  JobSatPoints_11           SurveyLength SurveyEase ConvertedCompYearly JobSat
0             NaN                    NaN        NaN                 NaN    NaN
1             0.0                    NaN        NaN                 NaN    NaN
2             NaN  Appropriate in length       Easy                 NaN    NaN
3             NaN               Too long       Easy                 NaN    NaN
4             NaN              Too short       Easy                 NaN    NaN

[5 rows x 114 columns]
Initial dataframe: (65437, 114)
#df = pd.read_csv("https://cf-courses-data.s3.us.cloud-object-storage.appdomain.cloud/n01PQ9pSmiRX6520flujwQ/survey-data.csv")
Section 1: Handling Duplicates
Task 1: Identify and remove duplicate rows.
## Write your code here
frdupl = []
for col in df.columns:
    nunique = df[col].nunique(dropna=False) # number of unique values for this column
    frdupl.append((col, round(((df[col].size - nunique) / df[col].size), 4)))
frdupl = sorted(frdupl, key=lambda n:n[1])
print('Fraction of duplicates in each column')
for i in range(5):
    print(*frdupl[i], sep=': ')
Fraction of duplicates in each column
ResponseId: 0.0
LanguageHaveWorkedWith: 0.6353
LanguageWantToWorkWith: 0.652
ToolsTechHaveWorkedWith: 0.6961
ToolsTechWantToWorkWith: 0.7471
## Write your code here
subset_cols = list(df.drop(['ResponseId'], axis=1).columns)
dup_rows = df[df.duplicated(subset=subset_cols)]
print('Number of duplicate rows:', dup_rows.shape[0])
df_d = df.drop_duplicates(subset=subset_cols)
print('Final dataframe:', df_d.shape)
Number of duplicate rows: 487
Final dataframe: (64950, 114)
Section 2: Handling Missing Values
Task 2: Identify missing values in CodingActivities.
## Write your code here
frnan = df_d.isna().mean().sort_values(ascending=False).round(decimals=4)
print('Fraction of missing values in each column')
print(frnan.head())
print('CodingActivities:', frnan.CodingActivities)
print('ConvertedCompYearly:', frnan.ConvertedCompYearly)
Fraction of missing values in each column
AINextMuch less integrated    0.9823
AINextLess integrated         0.9637
AINextNo change               0.8076
AINextMuch more integrated    0.7931
EmbeddedAdmired               0.7424
dtype: float64
CodingActivities: 0.1641
ConvertedCompYearly: 0.6392
Task 3: Impute missing values in CodingActivities with forward-fill.
print(df_d.CodingActivities.describe())
count     54293
unique      118
top       Hobby
freq       9936
Name: CodingActivities, dtype: object
## Write your code here
df_dm = df_d.copy()
df_dm['CodingActivities'] = df_dm['CodingActivities'].ffill()
print(df_dm['CodingActivities'].describe())
count     64950
unique      118
top       Hobby
freq      11851
Name: CodingActivities, dtype: object
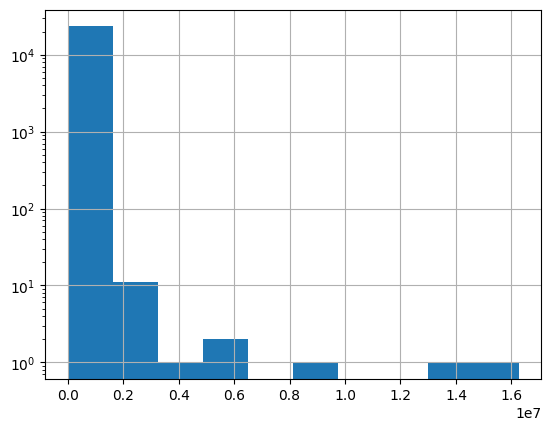
Note: Before normalizing ConvertedCompYearly, ensure that any missing values (NaN) in this column are handled appropriately. You can choose to either drop the rows containing NaN or replace the missing values with a suitable statistic (e.g., median or mean).
## Write your code here
print(df_dm.ConvertedCompYearly.describe().astype(int))
count       23435
mean        86155
std        186756
min             1
25%         32712
50%         65000
75%        107971
max      16256603
Name: ConvertedCompYearly, dtype: int64
print('Number of unique values:', len(df_dm.ConvertedCompYearly.unique()))
df_dm.ConvertedCompYearly.hist(log=True)
plt.show()
Number of unique values: 6114
## Write your code here
# The data in the ConvertedCompYearly column has 64% missing values and it is skewed.
# Hence, it is better to use a median value.
MedianValue = df_dm['ConvertedCompYearly'].median()
df_dm['ConvertedCompYearly'] = df_dm['ConvertedCompYearly'].fillna(MedianValue)
print(df_dm['ConvertedCompYearly'].describe().astype(int))
count       64950
mean        72633
std        112638
min             1
25%         65000
50%         65000
75%         65000
max      16256603
Name: ConvertedCompYearly, dtype: int64
Section 3: Normalizing Compensation Data
Task 4: Identify compensation-related columns, such as ConvertedCompYearly.
Normalization is commonly applied to compensation data to bring values within a comparable range. Here, you’ll identify ConvertedCompYearly or similar columns, which contain compensation information. This column will be used in the subsequent tasks for normalization.
## Write your code here
for col in df_dm.columns:
    if 'comp' in col.lower():
        print(col)
CompTotal
AIComplex
ConvertedCompYearly
Task 5: Normalize ConvertedCompYearly using Min-Max Scaling.
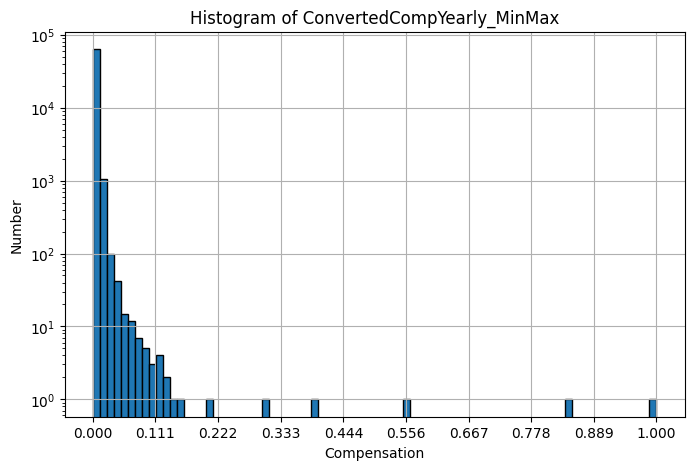
Min-Max Scaling brings all values in a column to a 0-1 range, making it useful for comparing data across different scales. Here, you will apply Min-Max normalization to the ConvertedCompYearly column, creating a new column ConvertedCompYearly_MinMax with normalized values.
## Write your code here
df_dm['ConvertedCompYearly_MinMax'] = (df_dm['ConvertedCompYearly'] - df_dm['ConvertedCompYearly'].min()) / (df_dm['ConvertedCompYearly'].max() - df_dm['ConvertedCompYearly'].min())
print(df_dm['ConvertedCompYearly_MinMax'].describe())
count    64950.000000
mean         0.004468
std          0.006929
min          0.000000
25%          0.003998
50%          0.003998
75%          0.003998
max          1.000000
Name: ConvertedCompYearly_MinMax, dtype: float64
Task 6: Apply Z-score Normalization to ConvertedCompYearly.
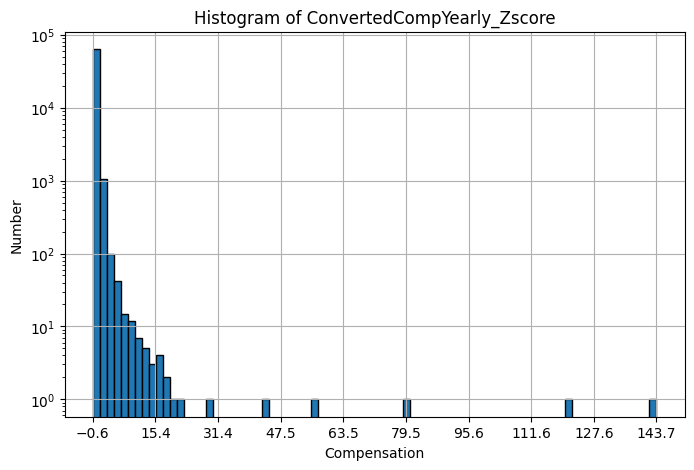
Z-score normalization standardizes values by converting them to a distribution with a mean of 0 and a standard deviation of 1. This method is helpful for datasets with a Gaussian (normal) distribution. Here, you’ll calculate Z-scores for the ConvertedCompYearly column, saving the results in a new column ConvertedCompYearly_Zscore.
## Write your code here
df_dm['ConvertedCompYearly_Zscore'] = (df_dm['ConvertedCompYearly'] - df_dm['ConvertedCompYearly'].mean()) / df_dm['ConvertedCompYearly'].std()
print(df_dm['ConvertedCompYearly_Zscore'].describe())
count    6.495000e+04
mean     2.100450e-17
std      1.000000e+00
min     -6.448243e-01
25%     -6.776682e-02
50%     -6.776682e-02
75%     -6.776682e-02
max      1.436804e+02
Name: ConvertedCompYearly_Zscore, dtype: float64
Section 4: Visualization of Normalized Data
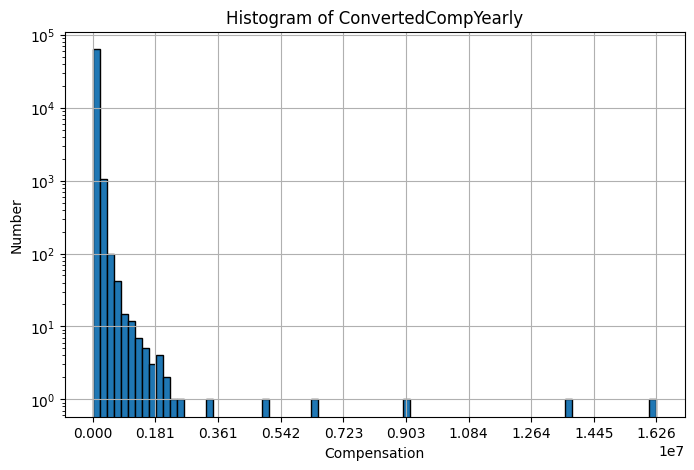
Task 7: Visualize the distribution of ConvertedCompYearly, ConvertedCompYearly_Normalized, and ConvertedCompYearly_Zscore
Visualization helps you understand how normalization changes the data distribution. In this task, create histograms for the original ConvertedCompYearly, as well as its normalized versions (ConvertedCompYearly_MinMax and ConvertedCompYearly_Zscore). This will help you compare how each normalization technique affects the data range and distribution.
## Write your code here
for col in ['ConvertedCompYearly', 'ConvertedCompYearly_MinMax', 'ConvertedCompYearly_Zscore']:
    bins = int(2 * (len(df_dm[col]) ** (1/3)))  # Rice Rule (more robust for large datasets)
    nticks = int(bins / 8)
    ticks = np.linspace(df_dm[col].min(), df_dm[col].max(), nticks)
    h = df_dm[col].hist(figsize=(8, 5), bins=bins, edgecolor='black', log=True)
    h.set(title=f'Histogram of {col}', ylabel='Number', xticks=ticks, xlabel='Compensation')
    plt.show()
Summary
In this lab, you practiced essential normalization techniques, including:
-
Identifying and handling duplicate rows.
-
Checking for and imputing missing values.
-
Applying Min-Max scaling and Z-score normalization to compensation data.
-
Visualizing the impact of normalization on data distribution.
Copyright © IBM Corporation. All rights reserved.