
Finding Missing Values
Estimated time needed: 30 minutes
Data wrangling is the process of cleaning, transforming, and organizing data to make it suitable for analysis. Finding and handling missing values is a crucial step in this process to ensure data accuracy and completeness. In this lab, you will focus exclusively on identifying and handling missing values in the dataset.
Objectives
After completing this lab, you will be able to:
-
Identify missing values in the dataset.
-
Quantify missing values for specific columns.
-
Impute missing values using various strategies.
Hands on Lab
Setup: Install Required Libraries
!pip install pandas
!pip install matplotlib
!pip install seaborn
Collecting pandas
Downloading pandas-3.0.0-cp312-cp312-manylinux_2_24_x86_64.manylinux_2_28_x86_64.whl.metadata (79 kB)
Collecting numpy>=1.26.0 (from pandas)
Downloading numpy-2.4.1-cp312-cp312-manylinux_2_27_x86_64.manylinux_2_28_x86_64.whl.metadata (6.6 kB)
Requirement already satisfied: python-dateutil>=2.8.2 in /opt/conda/lib/python3.12/site-packages (from pandas) (2.9.0.post0)
Requirement already satisfied: six>=1.5 in /opt/conda/lib/python3.12/site-packages (from python-dateutil>=2.8.2->pandas) (1.17.0)
Downloading pandas-3.0.0-cp312-cp312-manylinux_2_24_x86_64.manylinux_2_28_x86_64.whl (10.9 MB)
[2K [90m━━━━━━━━━━━━━━━━━━━━━━━━━━━━━━━━━━━━━━━━[0m [32m10.9/10.9 MB[0m [31m136.1 MB/s[0m eta [36m0:00:00[0m
[?25hDownloading numpy-2.4.1-cp312-cp312-manylinux_2_27_x86_64.manylinux_2_28_x86_64.whl (16.4 MB)
[2K [90m━━━━━━━━━━━━━━━━━━━━━━━━━━━━━━━━━━━━━━━━[0m [32m16.4/16.4 MB[0m [31m177.0 MB/s[0m eta [36m0:00:00[0m
Installing collected packages: numpy, pandas
Successfully installed numpy-2.4.1 pandas-3.0.0
Collecting matplotlib
Downloading matplotlib-3.10.8-cp312-cp312-manylinux2014_x86_64.manylinux_2_17_x86_64.whl.metadata (52 kB)
Collecting contourpy>=1.0.1 (from matplotlib)
Downloading contourpy-1.3.3-cp312-cp312-manylinux_2_27_x86_64.manylinux_2_28_x86_64.whl.metadata (5.5 kB)
Collecting cycler>=0.10 (from matplotlib)
Downloading cycler-0.12.1-py3-none-any.whl.metadata (3.8 kB)
Collecting fonttools>=4.22.0 (from matplotlib)
Downloading fonttools-4.61.1-cp312-cp312-manylinux1_x86_64.manylinux2014_x86_64.manylinux_2_17_x86_64.manylinux_2_5_x86_64.whl.metadata (114 kB)
Collecting kiwisolver>=1.3.1 (from matplotlib)
Downloading kiwisolver-1.4.9-cp312-cp312-manylinux2014_x86_64.manylinux_2_17_x86_64.whl.metadata (6.3 kB)
Requirement already satisfied: numpy>=1.23 in /opt/conda/lib/python3.12/site-packages (from matplotlib) (2.4.1)
Requirement already satisfied: packaging>=20.0 in /opt/conda/lib/python3.12/site-packages (from matplotlib) (24.2)
Collecting pillow>=8 (from matplotlib)
Downloading pillow-12.1.0-cp312-cp312-manylinux_2_27_x86_64.manylinux_2_28_x86_64.whl.metadata (8.8 kB)
Collecting pyparsing>=3 (from matplotlib)
Downloading pyparsing-3.3.2-py3-none-any.whl.metadata (5.8 kB)
Requirement already satisfied: python-dateutil>=2.7 in /opt/conda/lib/python3.12/site-packages (from matplotlib) (2.9.0.post0)
Requirement already satisfied: six>=1.5 in /opt/conda/lib/python3.12/site-packages (from python-dateutil>=2.7->matplotlib) (1.17.0)
Downloading matplotlib-3.10.8-cp312-cp312-manylinux2014_x86_64.manylinux_2_17_x86_64.whl (8.7 MB)
[2K [90m━━━━━━━━━━━━━━━━━━━━━━━━━━━━━━━━━━━━━━━━[0m [32m8.7/8.7 MB[0m [31m95.7 MB/s[0m eta [36m0:00:00[0m
[?25hDownloading contourpy-1.3.3-cp312-cp312-manylinux_2_27_x86_64.manylinux_2_28_x86_64.whl (362 kB)
Downloading cycler-0.12.1-py3-none-any.whl (8.3 kB)
Downloading fonttools-4.61.1-cp312-cp312-manylinux1_x86_64.manylinux2014_x86_64.manylinux_2_17_x86_64.manylinux_2_5_x86_64.whl (5.0 MB)
[2K [90m━━━━━━━━━━━━━━━━━━━━━━━━━━━━━━━━━━━━━━━━[0m [32m5.0/5.0 MB[0m [31m67.3 MB/s[0m eta [36m0:00:00[0m
[?25hDownloading kiwisolver-1.4.9-cp312-cp312-manylinux2014_x86_64.manylinux_2_17_x86_64.whl (1.5 MB)
[2K [90m━━━━━━━━━━━━━━━━━━━━━━━━━━━━━━━━━━━━━━━━[0m [32m1.5/1.5 MB[0m [31m92.2 MB/s[0m eta [36m0:00:00[0m
[?25hDownloading pillow-12.1.0-cp312-cp312-manylinux_2_27_x86_64.manylinux_2_28_x86_64.whl (7.0 MB)
[2K [90m━━━━━━━━━━━━━━━━━━━━━━━━━━━━━━━━━━━━━━━━[0m [32m7.0/7.0 MB[0m [31m179.2 MB/s[0m eta [36m0:00:00[0m
[?25hDownloading pyparsing-3.3.2-py3-none-any.whl (122 kB)
Installing collected packages: pyparsing, pillow, kiwisolver, fonttools, cycler, contourpy, matplotlib
Successfully installed contourpy-1.3.3 cycler-0.12.1 fonttools-4.61.1 kiwisolver-1.4.9 matplotlib-3.10.8 pillow-12.1.0 pyparsing-3.3.2
Collecting seaborn
Downloading seaborn-0.13.2-py3-none-any.whl.metadata (5.4 kB)
Requirement already satisfied: numpy!=1.24.0,>=1.20 in /opt/conda/lib/python3.12/site-packages (from seaborn) (2.4.1)
Requirement already satisfied: pandas>=1.2 in /opt/conda/lib/python3.12/site-packages (from seaborn) (3.0.0)
Requirement already satisfied: matplotlib!=3.6.1,>=3.4 in /opt/conda/lib/python3.12/site-packages (from seaborn) (3.10.8)
Requirement already satisfied: contourpy>=1.0.1 in /opt/conda/lib/python3.12/site-packages (from matplotlib!=3.6.1,>=3.4->seaborn) (1.3.3)
Requirement already satisfied: cycler>=0.10 in /opt/conda/lib/python3.12/site-packages (from matplotlib!=3.6.1,>=3.4->seaborn) (0.12.1)
Requirement already satisfied: fonttools>=4.22.0 in /opt/conda/lib/python3.12/site-packages (from matplotlib!=3.6.1,>=3.4->seaborn) (4.61.1)
Requirement already satisfied: kiwisolver>=1.3.1 in /opt/conda/lib/python3.12/site-packages (from matplotlib!=3.6.1,>=3.4->seaborn) (1.4.9)
Requirement already satisfied: packaging>=20.0 in /opt/conda/lib/python3.12/site-packages (from matplotlib!=3.6.1,>=3.4->seaborn) (24.2)
Requirement already satisfied: pillow>=8 in /opt/conda/lib/python3.12/site-packages (from matplotlib!=3.6.1,>=3.4->seaborn) (12.1.0)
Requirement already satisfied: pyparsing>=3 in /opt/conda/lib/python3.12/site-packages (from matplotlib!=3.6.1,>=3.4->seaborn) (3.3.2)
Requirement already satisfied: python-dateutil>=2.7 in /opt/conda/lib/python3.12/site-packages (from matplotlib!=3.6.1,>=3.4->seaborn) (2.9.0.post0)
Requirement already satisfied: six>=1.5 in /opt/conda/lib/python3.12/site-packages (from python-dateutil>=2.7->matplotlib!=3.6.1,>=3.4->seaborn) (1.17.0)
Downloading seaborn-0.13.2-py3-none-any.whl (294 kB)
Installing collected packages: seaborn
Successfully installed seaborn-0.13.2
Import Necessary Modules:
import pandas as pd
import matplotlib.pyplot as plt
import seaborn as sns
import textwrap
Tasks
1. Load the Dataset
We use the pandas.read_csv() function for reading CSV files. However, in this version of the lab, which operates on JupyterLite, the dataset needs to be downloaded to the interface using the provided code below.
The functions below will download the dataset into your browser:
# Define the URL of the dataset
file_path = "https://cf-courses-data.s3.us.cloud-object-storage.appdomain.cloud/n01PQ9pSmiRX6520flujwQ/survey-data.csv"

# Load the dataset into a DataFrame
df = pd.read_csv(file_path)

# Display the first few rows to ensure it loaded correctly
print(df.head())

print(df.shape)
   ResponseId                      MainBranch                 Age  \
0           1  I am a developer by profession  Under 18 years old
1           2  I am a developer by profession     35-44 years old
2           3  I am a developer by profession     45-54 years old
3           4           I am learning to code     18-24 years old
4           5  I am a developer by profession     18-24 years old

            Employment RemoteWork   Check  \
0  Employed, full-time     Remote  Apples
1  Employed, full-time     Remote  Apples
2  Employed, full-time     Remote  Apples
3   Student, full-time        NaN  Apples
4   Student, full-time        NaN  Apples

                                    CodingActivities  \
0                                              Hobby
1  Hobby;Contribute to open-source projects;Other...
2  Hobby;Contribute to open-source projects;Other...
3                                                NaN
4                                                NaN

                                             EdLevel  \
0                          Primary/elementary school
1       Bachelor’s degree (B.A., B.S., B.Eng., etc.)
2    Master’s degree (M.A., M.S., M.Eng., MBA, etc.)
3  Some college/university study without earning ...
4  Secondary school (e.g. American high school, G...

                                           LearnCode  \
0                             Books / Physical media
1  Books / Physical media;Colleague;On the job tr...
2  Books / Physical media;Colleague;On the job tr...
3  Other online resources (e.g., videos, blogs, f...
4  Other online resources (e.g., videos, blogs, f...

                                     LearnCodeOnline  ... JobSatPoints_6  \
0                                                NaN  ...            NaN
1  Technical documentation;Blogs;Books;Written Tu...  ...            0.0
2  Technical documentation;Blogs;Books;Written Tu...  ...            NaN
3  Stack Overflow;How-to videos;Interactive tutorial  ...            NaN
4  Technical documentation;Blogs;Written Tutorial...  ...            NaN

  JobSatPoints_7 JobSatPoints_8 JobSatPoints_9 JobSatPoints_10  \
0            NaN            NaN            NaN             NaN
1            0.0            0.0            0.0             0.0
2            NaN            NaN            NaN             NaN
3            NaN            NaN            NaN             NaN
4            NaN            NaN            NaN             NaN

  JobSatPoints_11           SurveyLength SurveyEase ConvertedCompYearly JobSat
0             NaN                    NaN        NaN                 NaN    NaN
1             0.0                    NaN        NaN                 NaN    NaN
2             NaN  Appropriate in length       Easy                 NaN    NaN
3             NaN               Too long       Easy                 NaN    NaN
4             NaN              Too short       Easy                 NaN    NaN

[5 rows x 114 columns]
(65437, 114)
2. Explore the Dataset
Task 1: Display basic information and summary statistics of the dataset.
## Write your code here
print(df.describe())
print(df.info())
         ResponseId      CompTotal       WorkExp  JobSatPoints_1  \
count  65437.000000   3.374000e+04  29658.000000    29324.000000
mean   32719.000000  2.963841e+145     11.466957       18.581094
std    18890.179119  5.444117e+147      9.168709       25.966221
min        1.000000   0.000000e+00      0.000000        0.000000
25%    16360.000000   6.000000e+04      4.000000        0.000000
50%    32719.000000   1.100000e+05      9.000000       10.000000
75%    49078.000000   2.500000e+05     16.000000       22.000000
max    65437.000000  1.000000e+150     50.000000      100.000000

       JobSatPoints_4  JobSatPoints_5  JobSatPoints_6  JobSatPoints_7  \
count    29393.000000    29411.000000    29450.000000     29448.00000
mean         7.522140       10.060857       24.343232        22.96522
std         18.422661       21.833836       27.089360        27.01774
min          0.000000        0.000000        0.000000         0.00000
25%          0.000000        0.000000        0.000000         0.00000
50%          0.000000        0.000000       20.000000        15.00000
75%          5.000000       10.000000       30.000000        30.00000
max        100.000000      100.000000      100.000000       100.00000

       JobSatPoints_8  JobSatPoints_9  JobSatPoints_10  JobSatPoints_11  \
count    29456.000000    29456.000000     29450.000000     29445.000000
mean        20.278165       16.169432        10.955713         9.953948
std         26.108110       24.845032        22.906263        21.775652
min          0.000000        0.000000         0.000000         0.000000
25%          0.000000        0.000000         0.000000         0.000000
50%         10.000000        5.000000         0.000000         0.000000
75%         25.000000       20.000000        10.000000        10.000000
max        100.000000      100.000000       100.000000       100.000000

       ConvertedCompYearly        JobSat
count         2.343500e+04  29126.000000
mean          8.615529e+04      6.935041
std           1.867570e+05      2.088259
min           1.000000e+00      0.000000
25%           3.271200e+04      6.000000
50%           6.500000e+04      7.000000
75%           1.079715e+05      8.000000
max           1.625660e+07     10.000000
<class 'pandas.DataFrame'>
RangeIndex: 65437 entries, 0 to 65436
Columns: 114 entries, ResponseId to JobSat
dtypes: float64(13), int64(1), str(100)
memory usage: 56.9 MB
None
3. Finding Missing Values
Task 2: Identify missing values for all columns.
## Write your code here
nnan = df.isna()
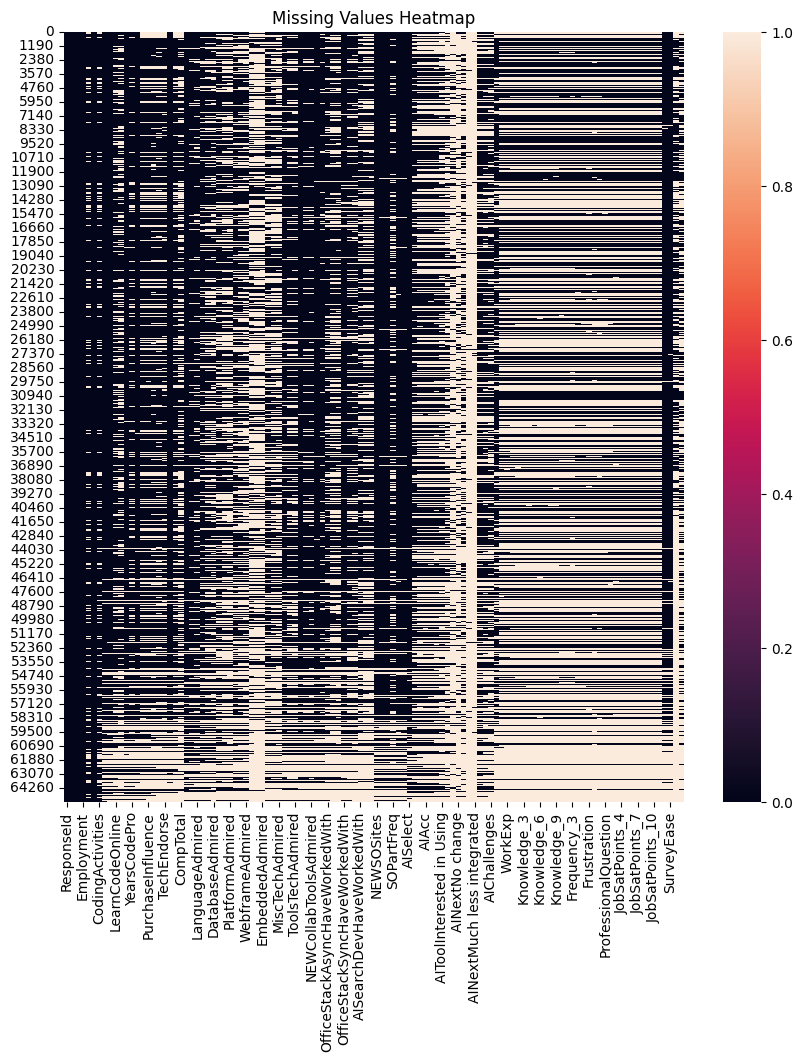
Task 3: Visualize missing values using a heatmap (Using seaborn library).
## Write your code here
plt.figure(figsize=(10, 10))
sns.heatmap(nnan)
plt.title("Missing Values Heatmap")
plt.show()
Task 4: Count the number of missing rows for a specific column (e.g., Employment).
## Write your code here
column = 'Employment'
nmrows = nnan[column].sum()
print(f'There are {nmrows} missing rows in {column} column')
print()
print(df.Employment.info())
There are 0 missing rows in Employment column

<class 'pandas.Series'>
RangeIndex: 65437 entries, 0 to 65436
Series name: Employment
Non-Null Count  Dtype
--------------  -----
65437 non-null  str
dtypes: str(1)
memory usage: 511.4 KB
None
4. Imputing Missing Values
Task 5: Identify the most frequent (majority) value in a specific column (e.g., Employment).
## Write your code here
print(df.Employment.describe().top)
Employed, full-time
Task 6: Impute missing values in the Employment column with the most frequent value.
## Write your code here
df_m = df.copy()
common_Employment = df_m['Employment'].value_counts().idxmax()
df_m['Employment'] = df_m['Employment'].fillna(common_Employment)
df_m['Employment'].describe()
count                   65437
unique                    110
top       Employed, full-time
freq                    39041
Name: Employment, dtype: object
5. Visualizing Imputed Data
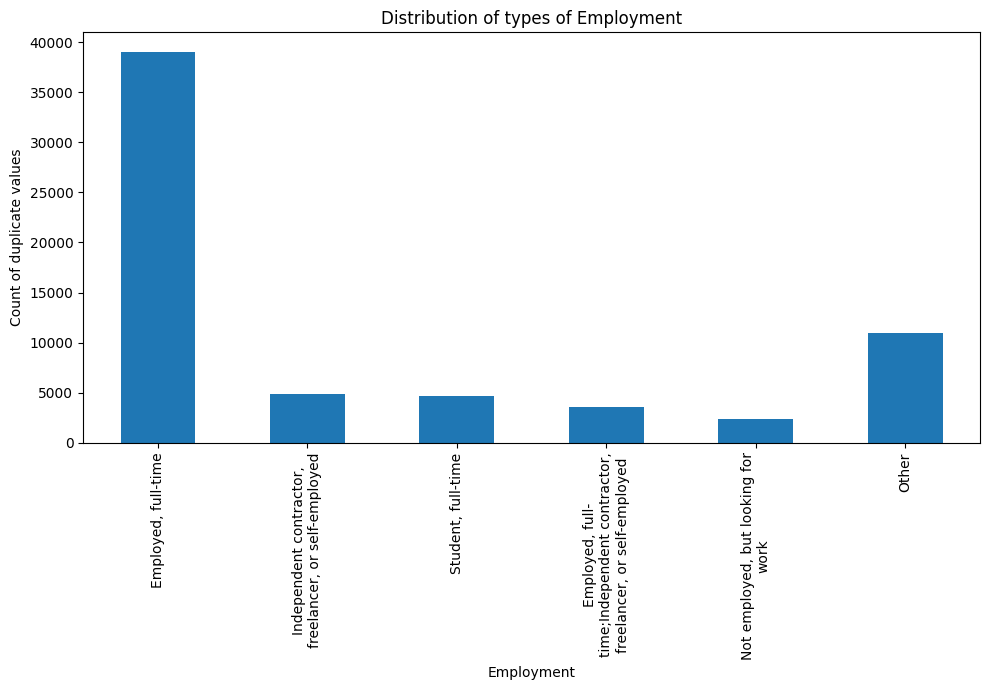
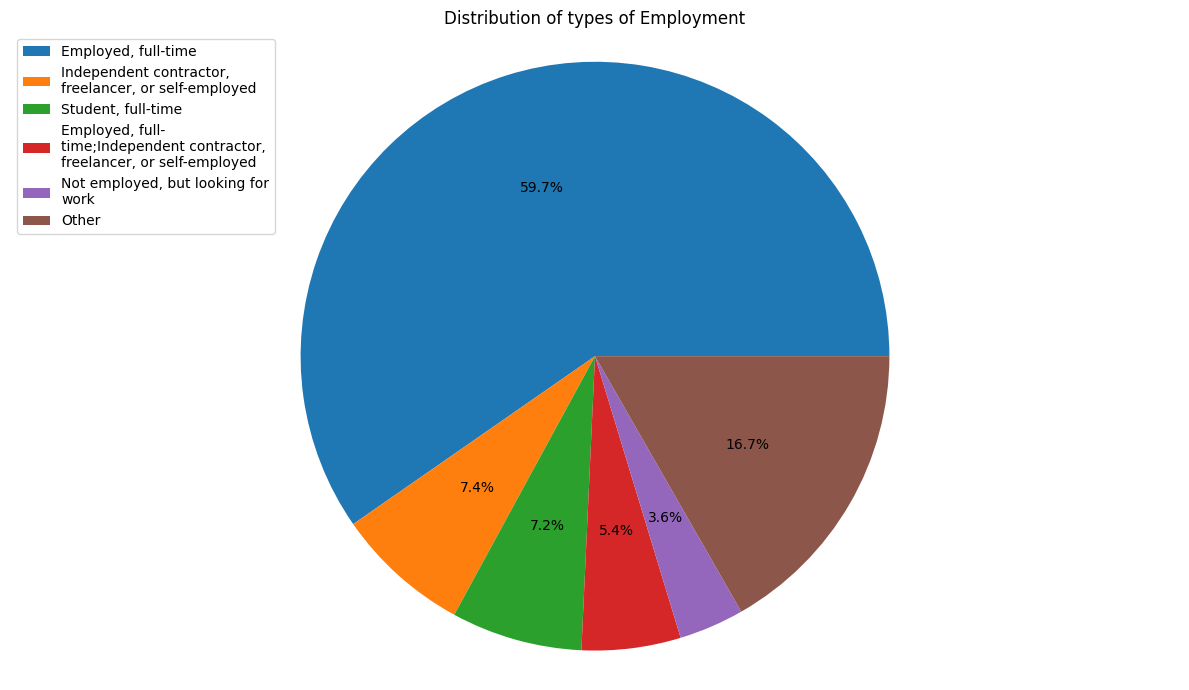
Task 7: Visualize the distribution of a column after imputation (e.g., Employment).
## Write your code here
def wrap_labels1(ax, width=30):
    labels = []
    for label in ax.get_xticklabels():
        text = label.get_text()
        labels.append(textwrap.fill(text, width=width))
    ax.set_xticklabels(labels, rotation=90)

plt.figure(figsize=(10, 7))
colpl = df_m['Employment'].value_counts()
colpl1 = colpl.iloc[0:5]
colpl1['Other'] = colpl.iloc[5:].sum()
ax = colpl1.plot(kind='bar')
wrap_labels1(ax)
plt.title('Distribution of types of Employment')
plt.xlabel('Employment')
plt.ylabel("Count of duplicate values")
plt.tight_layout()

wrapped_labels2 = ['\n'.join(textwrap.wrap(str(label), 30))  # 20 = wrap width
                  for label in colpl1.index]
plt.figure(figsize=(12, 7))
ax1 = colpl1.plot(kind='pie', autopct='%1.1f%%', labels=None)
plt.title('Distribution of types of Employment')
plt.legend(labels=wrapped_labels2, loc='upper left')
plt.tight_layout()
plt.axis('equal')
plt.show()
Summary
In this lab, you:
- Loaded the dataset into a pandas DataFrame.
- Identified missing values across all columns.
- Quantified missing values in specific columns.
- Imputed missing values in a categorical column using the most frequent value.
- Visualized the imputed data for better understanding.
Copyright © IBM Corporation. All rights reserved.