
Lab: Exploratory Data Analysis
Estimated time needed: 30 minutes
In this lab, you will work with a cleaned dataset to perform Exploratory Data Analysis or EDA.
Objectives
In this lab, you will perform the following:
-
Examine the structure of a dataset.
-
Handle missing values effectively.
-
Conduct summary statistics on key columns.
-
Analyze employment status, job satisfaction, programming language usage, and trends in remote work.
Hands on Lab
Step 1: Install and Import Libraries
Install the necessary libraries for data manipulation and visualization.
!pip install pandas
!pip install matplotlib
!pip install seaborn

import pandas as pd
import matplotlib.pyplot as plt
import seaborn as sns
import textwrap
Requirement already satisfied: pandas in /opt/conda/lib/python3.12/site-packages (3.0.0)
Requirement already satisfied: numpy>=1.26.0 in /opt/conda/lib/python3.12/site-packages (from pandas) (2.4.1)
Requirement already satisfied: python-dateutil>=2.8.2 in /opt/conda/lib/python3.12/site-packages (from pandas) (2.9.0.post0)
Requirement already satisfied: six>=1.5 in /opt/conda/lib/python3.12/site-packages (from python-dateutil>=2.8.2->pandas) (1.17.0)
Requirement already satisfied: matplotlib in /opt/conda/lib/python3.12/site-packages (3.10.8)
Requirement already satisfied: contourpy>=1.0.1 in /opt/conda/lib/python3.12/site-packages (from matplotlib) (1.3.3)
Requirement already satisfied: cycler>=0.10 in /opt/conda/lib/python3.12/site-packages (from matplotlib) (0.12.1)
Requirement already satisfied: fonttools>=4.22.0 in /opt/conda/lib/python3.12/site-packages (from matplotlib) (4.61.1)
Requirement already satisfied: kiwisolver>=1.3.1 in /opt/conda/lib/python3.12/site-packages (from matplotlib) (1.4.9)
Requirement already satisfied: numpy>=1.23 in /opt/conda/lib/python3.12/site-packages (from matplotlib) (2.4.1)
Requirement already satisfied: packaging>=20.0 in /opt/conda/lib/python3.12/site-packages (from matplotlib) (24.2)
Requirement already satisfied: pillow>=8 in /opt/conda/lib/python3.12/site-packages (from matplotlib) (12.1.0)
Requirement already satisfied: pyparsing>=3 in /opt/conda/lib/python3.12/site-packages (from matplotlib) (3.3.2)
Requirement already satisfied: python-dateutil>=2.7 in /opt/conda/lib/python3.12/site-packages (from matplotlib) (2.9.0.post0)
Requirement already satisfied: six>=1.5 in /opt/conda/lib/python3.12/site-packages (from python-dateutil>=2.7->matplotlib) (1.17.0)
Requirement already satisfied: seaborn in /opt/conda/lib/python3.12/site-packages (0.13.2)
Requirement already satisfied: numpy!=1.24.0,>=1.20 in /opt/conda/lib/python3.12/site-packages (from seaborn) (2.4.1)
Requirement already satisfied: pandas>=1.2 in /opt/conda/lib/python3.12/site-packages (from seaborn) (3.0.0)
Requirement already satisfied: matplotlib!=3.6.1,>=3.4 in /opt/conda/lib/python3.12/site-packages (from seaborn) (3.10.8)
Requirement already satisfied: contourpy>=1.0.1 in /opt/conda/lib/python3.12/site-packages (from matplotlib!=3.6.1,>=3.4->seaborn) (1.3.3)
Requirement already satisfied: cycler>=0.10 in /opt/conda/lib/python3.12/site-packages (from matplotlib!=3.6.1,>=3.4->seaborn) (0.12.1)
Requirement already satisfied: fonttools>=4.22.0 in /opt/conda/lib/python3.12/site-packages (from matplotlib!=3.6.1,>=3.4->seaborn) (4.61.1)
Requirement already satisfied: kiwisolver>=1.3.1 in /opt/conda/lib/python3.12/site-packages (from matplotlib!=3.6.1,>=3.4->seaborn) (1.4.9)
Requirement already satisfied: packaging>=20.0 in /opt/conda/lib/python3.12/site-packages (from matplotlib!=3.6.1,>=3.4->seaborn) (24.2)
Requirement already satisfied: pillow>=8 in /opt/conda/lib/python3.12/site-packages (from matplotlib!=3.6.1,>=3.4->seaborn) (12.1.0)
Requirement already satisfied: pyparsing>=3 in /opt/conda/lib/python3.12/site-packages (from matplotlib!=3.6.1,>=3.4->seaborn) (3.3.2)
Requirement already satisfied: python-dateutil>=2.7 in /opt/conda/lib/python3.12/site-packages (from matplotlib!=3.6.1,>=3.4->seaborn) (2.9.0.post0)
Requirement already satisfied: six>=1.5 in /opt/conda/lib/python3.12/site-packages (from python-dateutil>=2.7->matplotlib!=3.6.1,>=3.4->seaborn) (1.17.0)
Step 2: Load and Preview the Dataset
Load the dataset from the provided URL. Use df.head() to display the first few rows to get an overview of the structure.
# Load the Stack Overflow survey dataset
data_url = 'https://cf-courses-data.s3.us.cloud-object-storage.appdomain.cloud/n01PQ9pSmiRX6520flujwQ/survey-data.csv'
df = pd.read_csv(data_url)

# Set pandas option to display all columns
pd.set_option('display.max_columns', None)

# Display the first few rows of the dataset
print(df.head())
print('Initial dataframe:', df.shape)
ResponseId MainBranch Age \
0 1 I am a developer by profession Under 18 years old
1 2 I am a developer by profession 35-44 years old
2 3 I am a developer by profession 45-54 years old
3 4 I am learning to code 18-24 years old
4 5 I am a developer by profession 18-24 years old
Employment RemoteWork Check \
0 Employed, full-time Remote Apples
1 Employed, full-time Remote Apples
2 Employed, full-time Remote Apples
3 Student, full-time NaN Apples
4 Student, full-time NaN Apples
CodingActivities \
0 Hobby
1 Hobby;Contribute to open-source projects;Other...
2 Hobby;Contribute to open-source projects;Other...
3 NaN
4 NaN
EdLevel \
0 Primary/elementary school
1 Bachelor’s degree (B.A., B.S., B.Eng., etc.)
2 Master’s degree (M.A., M.S., M.Eng., MBA, etc.)
3 Some college/university study without earning ...
4 Secondary school (e.g. American high school, G...
LearnCode \
0 Books / Physical media
1 Books / Physical media;Colleague;On the job tr...
2 Books / Physical media;Colleague;On the job tr...
3 Other online resources (e.g., videos, blogs, f...
4 Other online resources (e.g., videos, blogs, f...
LearnCodeOnline \
0 NaN
1 Technical documentation;Blogs;Books;Written Tu...
2 Technical documentation;Blogs;Books;Written Tu...
3 Stack Overflow;How-to videos;Interactive tutorial
4 Technical documentation;Blogs;Written Tutorial...
TechDoc YearsCode YearsCodePro \
0 NaN NaN NaN
1 API document(s) and/or SDK document(s);User gu... 20 17
2 API document(s) and/or SDK document(s);User gu... 37 27
3 NaN 4 NaN
4 API document(s) and/or SDK document(s);User gu... 9 NaN
DevType OrgSize PurchaseInfluence BuyNewTool BuildvsBuy \
0 NaN NaN NaN NaN NaN
1 Developer, full-stack NaN NaN NaN NaN
2 Developer Experience NaN NaN NaN NaN
3 Developer, full-stack NaN NaN NaN NaN
4 Developer, full-stack NaN NaN NaN NaN
TechEndorse Country Currency \
0 NaN United States of America NaN
1 NaN United Kingdom of Great Britain and Northern I... NaN
2 NaN United Kingdom of Great Britain and Northern I... NaN
3 NaN Canada NaN
4 NaN Norway NaN
CompTotal LanguageHaveWorkedWith \
0 NaN NaN
1 NaN Bash/Shell (all shells);Go;HTML/CSS;Java;JavaS...
2 NaN C#
3 NaN C;C++;HTML/CSS;Java;JavaScript;PHP;PowerShell;...
4 NaN C++;HTML/CSS;JavaScript;Lua;Python;Rust
LanguageWantToWorkWith \
0 NaN
1 Bash/Shell (all shells);Go;HTML/CSS;Java;JavaS...
2 C#
3 HTML/CSS;Java;JavaScript;PowerShell;Python;SQL...
4 C++;HTML/CSS;JavaScript;Lua;Python
LanguageAdmired \
0 NaN
1 Bash/Shell (all shells);Go;HTML/CSS;Java;JavaS...
2 C#
3 HTML/CSS;Java;JavaScript;PowerShell;Python;SQL...
4 C++;HTML/CSS;JavaScript;Lua;Python
DatabaseHaveWorkedWith DatabaseWantToWorkWith \
0 NaN NaN
1 Dynamodb;MongoDB;PostgreSQL PostgreSQL
2 Firebase Realtime Database Firebase Realtime Database
3 MongoDB;MySQL;PostgreSQL;SQLite MongoDB;MySQL;PostgreSQL
4 PostgreSQL;SQLite PostgreSQL;SQLite
DatabaseAdmired PlatformHaveWorkedWith \
0 NaN NaN
1 PostgreSQL Amazon Web Services (AWS);Heroku;Netlify
2 Firebase Realtime Database Google Cloud
3 MongoDB;MySQL;PostgreSQL Amazon Web Services (AWS);Fly.io;Heroku
4 PostgreSQL;SQLite NaN
PlatformWantToWorkWith \
0 NaN
1 Amazon Web Services (AWS);Heroku;Netlify
2 Google Cloud
3 Amazon Web Services (AWS);Vercel
4 NaN
PlatformAdmired \
0 NaN
1 Amazon Web Services (AWS);Heroku;Netlify
2 Google Cloud
3 Amazon Web Services (AWS)
4 NaN
WebframeHaveWorkedWith WebframeWantToWorkWith \
0 NaN NaN
1 Express;Next.js;Node.js;React Express;Htmx;Node.js;React;Remix
2 ASP.NET CORE ASP.NET CORE
3 jQuery;Next.js;Node.js;React;WordPress jQuery;Next.js;Node.js;React
4 NaN NaN
WebframeAdmired EmbeddedHaveWorkedWith \
0 NaN NaN
1 Express;Node.js;React NaN
2 ASP.NET CORE Rasberry Pi
3 jQuery;Next.js;Node.js;React Rasberry Pi
4 NaN CMake;Cargo;Rasberry Pi
EmbeddedWantToWorkWith EmbeddedAdmired \
0 NaN NaN
1 NaN NaN
2 Rasberry Pi Rasberry Pi
3 NaN NaN
4 CMake;Rasberry Pi CMake;Rasberry Pi
MiscTechHaveWorkedWith \
0 NaN
1 NaN
2 .NET (5+) ;.NET Framework (1.0 - 4.8);.NET MAUI
3 NumPy;Pandas;Ruff;TensorFlow
4 NaN
MiscTechWantToWorkWith \
0 NaN
1 NaN
2 .NET (5+) ;.NET Framework (1.0 - 4.8);.NET MAUI
3 NaN
4 NaN
MiscTechAdmired \
0 NaN
1 NaN
2 .NET (5+) ;.NET Framework (1.0 - 4.8);.NET MAUI
3 NaN
4 NaN
ToolsTechHaveWorkedWith \
0 NaN
1 Docker;Homebrew;Kubernetes;npm;Vite;Webpack
2 MSBuild
3 Docker;npm;Pip
4 APT;Make;npm
ToolsTechWantToWorkWith \
0 NaN
1 Docker;Homebrew;Kubernetes;npm;Vite;Webpack
2 MSBuild
3 Docker;Kubernetes;npm
4 APT;Make
ToolsTechAdmired \
0 NaN
1 Docker;Homebrew;Kubernetes;npm;Vite;Webpack
2 MSBuild
3 Docker;npm
4 APT;Make
NEWCollabToolsHaveWorkedWith NEWCollabToolsWantToWorkWith \
0 NaN NaN
1 PyCharm;Visual Studio Code;WebStorm PyCharm;Visual Studio Code;WebStorm
2 Visual Studio Visual Studio
3 NaN NaN
4 Vim Vim
NEWCollabToolsAdmired OpSysPersonal use \
0 NaN NaN
1 PyCharm;Visual Studio Code;WebStorm MacOS;Windows
2 Visual Studio Windows
3 NaN NaN
4 Vim Other (please specify):
OpSysProfessional use OfficeStackAsyncHaveWorkedWith \
0 NaN NaN
1 MacOS NaN
2 Windows NaN
3 NaN NaN
4 NaN GitHub Discussions;Markdown File;Obsidian;Stac...
OfficeStackAsyncWantToWorkWith \
0 NaN
1 NaN
2 NaN
3 NaN
4 GitHub Discussions;Markdown File;Obsidian
OfficeStackAsyncAdmired \
0 NaN
1 NaN
2 NaN
3 NaN
4 GitHub Discussions;Markdown File;Obsidian
OfficeStackSyncHaveWorkedWith OfficeStackSyncWantToWorkWith \
0 NaN NaN
1 Microsoft Teams;Slack Slack
2 Google Chat;Google Meet;Microsoft Teams;Zoom Google Chat;Google Meet;Zoom
3 NaN NaN
4 Discord;Whatsapp Discord;Whatsapp
OfficeStackSyncAdmired AISearchDevHaveWorkedWith \
0 NaN NaN
1 Slack NaN
2 Google Chat;Google Meet;Zoom NaN
3 NaN NaN
4 Discord;Whatsapp NaN
AISearchDevWantToWorkWith AISearchDevAdmired \
0 NaN NaN
1 NaN NaN
2 NaN NaN
3 NaN NaN
4 NaN NaN
NEWSOSites SOVisitFreq \
0 I have never visited Stack Overflow or the Sta... NaN
1 Stack Overflow for Teams (private knowledge sh... Multiple times per day
2 Stack Overflow;Stack Exchange;Stack Overflow B... Multiple times per day
3 Stack Overflow Daily or almost daily
4 Stack Overflow for Teams (private knowledge sh... Multiple times per day
SOAccount SOPartFreq \
0 NaN NaN
1 Yes Multiple times per day
2 Yes Multiple times per day
3 No NaN
4 Yes Multiple times per day
SOHow SOComm \
0 NaN NaN
1 Quickly finding code solutions;Finding reliabl... Yes, definitely
2 Quickly finding code solutions;Finding reliabl... Yes, definitely
3 Quickly finding code solutions No, not really
4 Quickly finding code solutions;Engage with com... Yes, definitely
AISelect AISent \
0 Yes Very favorable
1 No, and I don't plan to NaN
2 No, and I don't plan to NaN
3 Yes Very favorable
4 No, and I don't plan to NaN
AIBen AIAcc \
0 Increase productivity NaN
1 NaN NaN
2 NaN NaN
3 Increase productivity;Greater efficiency;Impro... Somewhat trust
4 NaN NaN
AIComplex \
0 NaN
1 NaN
2 NaN
3 Bad at handling complex tasks
4 NaN
AIToolCurrently Using \
0 NaN
1 NaN
2 NaN
3 Learning about a codebase;Project planning;Wri...
4 NaN
AIToolInterested in Using \
0 NaN
1 NaN
2 NaN
3 Testing code;Committing and reviewing code;Pre...
4 NaN
AIToolNot interested in Using \
0 NaN
1 NaN
2 NaN
3 NaN
4 NaN
AINextMuch more integrated AINextNo change \
0 NaN NaN
1 NaN NaN
2 NaN NaN
3 Learning about a codebase;Project planning;Wri... NaN
4 NaN NaN
AINextMore integrated AINextLess integrated AINextMuch less integrated \
0 NaN NaN NaN
1 NaN NaN NaN
2 NaN NaN NaN
3 NaN NaN NaN
4 NaN NaN NaN
AIThreat AIEthics \
0 NaN NaN
1 NaN NaN
2 NaN NaN
3 No Circulating misinformation or disinformation;M...
4 NaN NaN
AIChallenges TBranch ICorPM WorkExp \
0 NaN No NaN NaN
1 NaN Yes Individual contributor 17.0
2 NaN No NaN NaN
3 Don’t trust the output or answers NaN NaN NaN
4 NaN NaN NaN NaN
Knowledge_1 Knowledge_2 Knowledge_3 Knowledge_4 Knowledge_5 \
0 NaN NaN NaN NaN NaN
1 Agree Disagree Agree Agree Agree
2 NaN NaN NaN NaN NaN
3 NaN NaN NaN NaN NaN
4 NaN NaN NaN NaN NaN
Knowledge_6 Knowledge_7 Knowledge_8 Knowledge_9 Frequency_1 \
0 NaN NaN NaN NaN NaN
1 Neither agree nor disagree Disagree Agree Agree NaN
2 NaN NaN NaN NaN NaN
3 NaN NaN NaN NaN NaN
4 NaN NaN NaN NaN NaN
Frequency_2 Frequency_3 TimeSearching TimeAnswering Frustration \
0 NaN NaN NaN NaN NaN
1 NaN NaN NaN NaN NaN
2 NaN NaN NaN NaN NaN
3 NaN NaN NaN NaN NaN
4 NaN NaN NaN NaN NaN
ProfessionalTech ProfessionalCloud ProfessionalQuestion Industry \
0 NaN NaN NaN NaN
1 NaN NaN NaN NaN
2 NaN NaN NaN NaN
3 NaN NaN NaN NaN
4 NaN NaN NaN NaN
JobSatPoints_1 JobSatPoints_4 JobSatPoints_5 JobSatPoints_6 \
0 NaN NaN NaN NaN
1 0.0 0.0 0.0 0.0
2 NaN NaN NaN NaN
3 NaN NaN NaN NaN
4 NaN NaN NaN NaN
JobSatPoints_7 JobSatPoints_8 JobSatPoints_9 JobSatPoints_10 \
0 NaN NaN NaN NaN
1 0.0 0.0 0.0 0.0
2 NaN NaN NaN NaN
3 NaN NaN NaN NaN
4 NaN NaN NaN NaN
JobSatPoints_11 SurveyLength SurveyEase ConvertedCompYearly \
0 NaN NaN NaN NaN
1 0.0 NaN NaN NaN
2 NaN Appropriate in length Easy NaN
3 NaN Too long Easy NaN
4 NaN Too short Easy NaN
JobSat
0 NaN
1 NaN
2 NaN
3 NaN
4 NaN
Initial dataframe: (65437, 114)
Step 3: Handling Missing Data
Identify and manage missing values in critical columns such as Employment, JobSat, and RemoteWork. Implement a strategy to fill or drop these values, depending on the significance of the missing data.
## Write your code here
frnan = df.isna().mean().sort_values(ascending=False).round(decimals=4)
print('Fraction of missing values in each column')
columns = ['Employment', 'JobSat', 'RemoteWork', 'YearsCodePro', 'LanguageHaveWorkedWith', 'JobSatPoints_1', 'EdLevel']
print(frnan[columns].sort_index())
Fraction of missing values in each column
EdLevel                   0.0711
Employment                0.0000
JobSat                    0.5549
JobSatPoints_1            0.5519
LanguageHaveWorkedWith    0.0870
RemoteWork                0.1625
YearsCodePro              0.2113
dtype: float64
#Employment column has no missing values
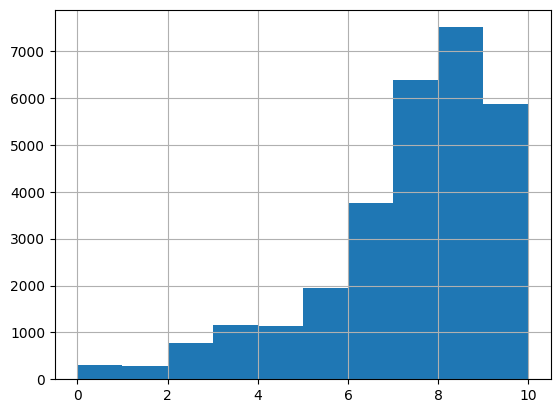
print(df[['JobSat']].info())
print('Number of unique values:', len(df.JobSat.unique()))
df.JobSat.hist()
plt.show()
<class 'pandas.DataFrame'>
RangeIndex: 65437 entries, 0 to 65436
Data columns (total 1 columns):
 #   Column  Non-Null Count  Dtype
---  ------  --------------  -----
 0   JobSat  29126 non-null  float64
dtypes: float64(1)
memory usage: 511.4 KB
None
Number of unique values: 12
df_m = df.copy()
# The data in the JobSat column has 55% missing values and it is skewed.
# Hence, it is better to omit missing values.
print(df[['RemoteWork']].describe())
ax = sns.countplot(data=df, x='RemoteWork')
labels = [textwrap.fill(label.get_text(), width=20) for label in ax.get_xticklabels()]
ax.set(xticklabels=labels)
plt.tight_layout()
plt.show()
                                  RemoteWork
count                                  54806
unique                                     3
top     Hybrid (some remote, some in-person)
freq                                   23015


/tmp/ipykernel_300/3573580997.py:4: UserWarning: set_ticklabels() should only be used with a fixed number of ticks, i.e. after set_ticks() or using a FixedLocator.
  ax.set(xticklabels=labels)
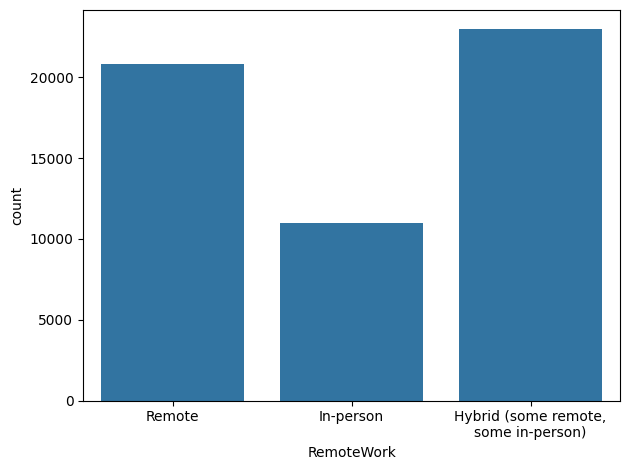
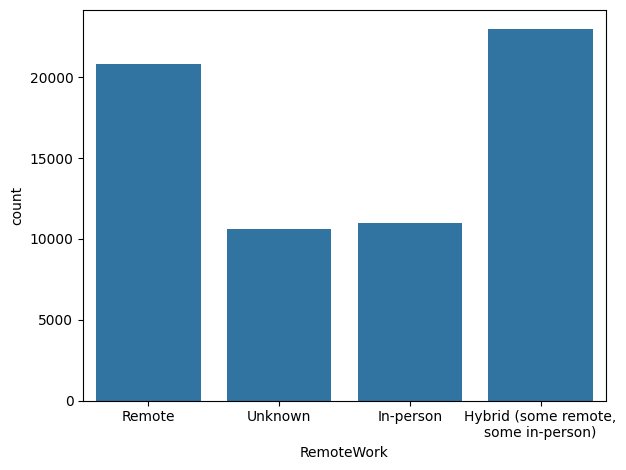
#The RemoteWork column has 16% missing values. Hence, it is better to add a new category.
df_m['RemoteWork'] = df_m['RemoteWork'].fillna('Unknown')
print(df_m['RemoteWork'].describe())
ax = sns.countplot(data=df_m, x='RemoteWork')
labels = [textwrap.fill(label.get_text(), width=20) for label in ax.get_xticklabels()]
ax.set(xticklabels=labels)
plt.tight_layout()
plt.show()
count                                    65437
unique                                       4
top       Hybrid (some remote, some in-person)
freq                                     23015
Name: RemoteWork, dtype: object


/tmp/ipykernel_300/3001049836.py:6: UserWarning: set_ticklabels() should only be used with a fixed number of ticks, i.e. after set_ticks() or using a FixedLocator.
  ax.set(xticklabels=labels)
Step 4: Analysis of Experience and Job Satisfaction
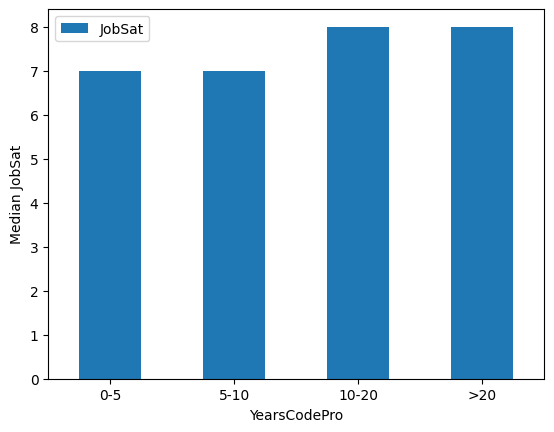
Analyze the relationship between years of professional coding experience (YearsCodePro) and job satisfaction (JobSat). Summarize YearsCodePro and calculate median satisfaction scores based on experience ranges.
-
Create experience ranges for
YearsCodePro(e.g.,0-5,5-10,10-20,>20years). -
Calculate the median
JobSatfor each range. -
Visualize the relationship using a bar plot or similar visualization.
## Write your code here
print(sorted(df_m.YearsCodePro.fillna('Unknown').unique()))
['1', '10', '11', '12', '13', '14', '15', '16', '17', '18', '19', '2', '20', '21', '22', '23', '24', '25', '26', '27', '28', '29', '3', '30', '31', '32', '33', '34', '35', '36', '37', '38', '39', '4', '40', '41', '42', '43', '44', '45', '46', '47', '48', '49', '5', '50', '6', '7', '8', '9', 'Less than 1 year', 'More than 50 years', 'Unknown']
df_fe = df_m[['YearsCodePro', 'JobSat']]
df_fe = df_fe.dropna()
df_fe = df_fe.replace({'Less than 1 year': 0, 'More than 50 years': 51}).astype(int)

import numpy as np
bins = [0, 5, 10, 20, 52]
group_names = ['0-5', '5-10', '10-20', '>20']
df_fe['YearsCodePro-binned'] = pd.cut(df_fe['YearsCodePro'], bins, labels=group_names, include_lowest=True)
df_feg = df_fe.groupby(by=['YearsCodePro-binned'])[['JobSat']].median()
print(df_feg)
                     JobSat
YearsCodePro-binned
0-5                     7.0
5-10                    7.0
10-20                   8.0
>20                     8.0
df_feg.plot(kind='bar', rot=0)
plt.xlabel('YearsCodePro')
plt.ylabel('Median JobSat')
Text(0, 0.5, 'Median JobSat')
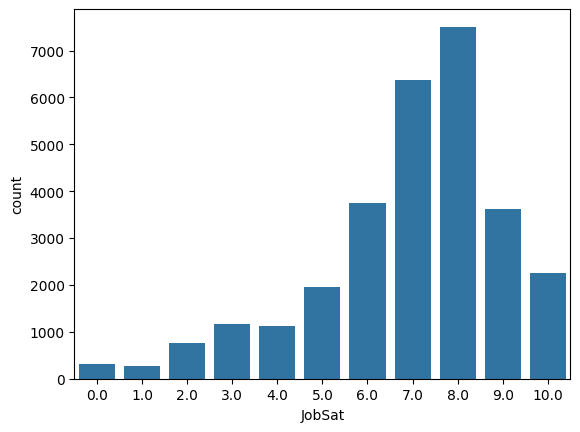
Step 5: Visualize Job Satisfaction
Use a count plot to show the distribution of JobSat values. This provides insights into the overall satisfaction levels of respondents.
## Write your code here
sns.countplot(data=df_m, x='JobSat')
<Axes: xlabel='JobSat', ylabel='count'>
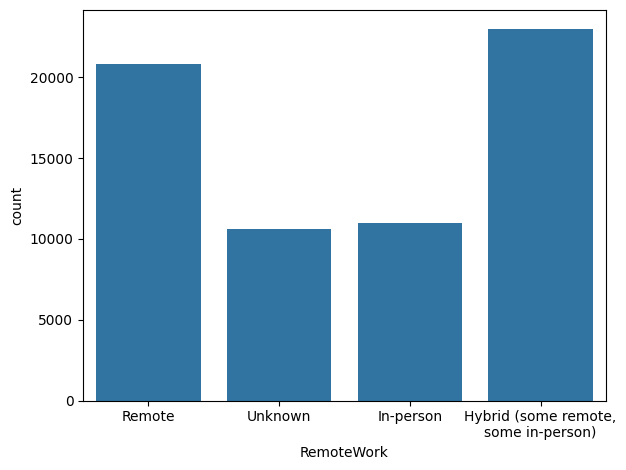
Step 6: Analyzing Remote Work Preferences by Job Role
Analyze trends in remote work based on job roles. Use the RemoteWork and Employment columns to explore preferences and examine if specific job roles prefer remote work more than others.
-
Use a count plot to show remote work distribution.
-
Cross-tabulate remote work preferences by employment type (e.g., full-time, part-time) and job roles.
## Write your code here
ax = sns.countplot(data=df_m, x='RemoteWork')
labels = [textwrap.fill(label.get_text(), width=20) for label in ax.get_xticklabels()]
ax.set(xticklabels=labels)
plt.tight_layout()
plt.show()
/tmp/ipykernel_300/3415317324.py:4: UserWarning: set_ticklabels() should only be used with a fixed number of ticks, i.e. after set_ticks() or using a FixedLocator.
  ax.set(xticklabels=labels)
#Encode the Employment column using one-hot encoding
cat = set()
empl = df_m.Employment.unique()
for el in empl:
    if ';' in el:
        cat = cat | set(el.split(';'))
    else:
        cat.add(el)
cat = sorted(cat)
print(cat, len(cat))  # Columns that should be added to the dataframe
['Employed, full-time', 'Employed, part-time', 'I prefer not to say', 'Independent contractor, freelancer, or self-employed', 'Not employed, and not looking for work', 'Not employed, but looking for work', 'Retired', 'Student, full-time', 'Student, part-time'] 9
df_me = df_m.copy()
dummies = df_me['Employment'].str.get_dummies(sep=';').astype(bool)
df_me = pd.concat([df_me, dummies], axis=1)
print(df_me[['Employment', *cat]].head())
print(df_me.shape)
            Employment  Employed, full-time  Employed, part-time  \
0  Employed, full-time                 True                False
1  Employed, full-time                 True                False
2  Employed, full-time                 True                False
3   Student, full-time                False                False
4   Student, full-time                False                False

   I prefer not to say  Independent contractor, freelancer, or self-employed  \
0                False                                              False
1                False                                              False
2                False                                              False
3                False                                              False
4                False                                              False

   Not employed, and not looking for work  Not employed, but looking for work  \
0                                   False                               False
1                                   False                               False
2                                   False                               False
3                                   False                               False
4                                   False                               False

   Retired  Student, full-time  Student, part-time
0    False               False               False
1    False               False               False
2    False               False               False
3    False                True               False
4    False                True               False
(65437, 123)
df_tab1 = pd.crosstab(df_me.DevType, df_me.RemoteWork).drop('Unknown', axis=1)
df_tab1['Remote_frac'] = df_tab1['Remote'] / df_tab1.sum(axis=1)
print(df_tab1.sort_values(by=['Remote_frac'], ascending=False))
#print(df_tab1)
RemoteWork                                     Hybrid (some remote, some in-person)  \
DevType
Blockchain                                                                       34
Developer Advocate                                                               29
Developer, game or graphics                                                     168
Developer, QA or test                                                           201
Cloud infrastructure engineer                                                   273
Developer Experience                                                             79
Developer, back-end                                                            3763
Developer, front-end                                                           1140
Developer, mobile                                                               675
Engineer, site reliability                                                      122
Designer                                                                         56
Security professional                                                           136
Developer, full-stack                                                          6934
Senior Executive (C-Suite, VP, etc.)                                            359
Engineering manager                                                             603
Data engineer                                                                   522
DevOps specialist                                                               500
Developer, AI                                                                   195
Product manager                                                                 130
Other (please specify):                                                         751
Database administrator                                                           64
Developer, desktop or enterprise applications                                   993
Data scientist or machine learning specialist                                   489
Marketing or sales professional                                                  33
Research & Development role                                                     432
Project manager                                                                 195
Student                                                                         265
Data or business analyst                                                        228
System administrator                                                            217
Educator                                                                        122
Developer, embedded applications or devices                                     745
Scientist                                                                       149
Academic researcher                                                             532
Hardware Engineer                                                                78

RemoteWork                                     In-person  Remote  Remote_frac
DevType
Blockchain                                            24     144     0.712871
Developer Advocate                                     9      61     0.616162
Developer, game or graphics                           95     256     0.493256
Developer, QA or test                                 61     229     0.466395
Cloud infrastructure engineer                         52     282     0.464580
Developer Experience                                  29      91     0.457286
Developer, back-end                                 1318    4179     0.451296
Developer, front-end                                 501    1342     0.449883
Developer, mobile                                    348     806     0.440678
Engineer, site reliability                            45     126     0.430034
Designer                                              24      57     0.416058
Security professional                                 46     127     0.411003
Developer, full-stack                               3143    6945     0.408001
Senior Executive (C-Suite, VP, etc.)                 124     326     0.402967
Engineering manager                                  160     483     0.387640
Data engineer                                        138     416     0.386617
DevOps specialist                                    102     368     0.379381
Developer, AI                                        107     169     0.358811
Product manager                                       55      89     0.324818
Other (please specify):                              495     599     0.324661
Database administrator                                43      50     0.318471
Developer, desktop or enterprise applications        589     727     0.314855
Data scientist or machine learning specialist        153     285     0.307443
Marketing or sales professional                       28      25     0.290698
Research & Development role                          200     248     0.281818
Project manager                                       93     107     0.270886
Student                                              268     195     0.267857
Data or business analyst                             123     123     0.259494
System administrator                                 164     107     0.219262
Educator                                             146      61     0.185410
Developer, embedded applications or devices          535     250     0.163399
Scientist                                             94      42     0.147368
Academic researcher                                  310     115     0.120167
Hardware Engineer                                     84      13     0.074286
df_tab2 = pd.DataFrame()
for col in dummies.columns:
    df_tab2[col] = df_me[df_me[col]].RemoteWork.value_counts()
df_tab2 = df_tab2.T.fillna(0).astype(int).drop('Unknown', axis=1)
df_tab2['Remote_frac'] = df_tab2['Remote'] / df_tab2.sum(axis=1)
print(df_tab2.sort_values(by=['Remote_frac'], ascending=False))
RemoteWork                                          Hybrid (some remote, some in-person)  \
Not employed, and not looking for work                                                27
Not employed, but looking for work                                                   204
Independent contractor, freelancer, or self-emp...                                  3469
Retired                                                                               39
Employed, full-time                                                                19689
Student, full-time                                                                  1219
Student, part-time                                                                   822
Employed, part-time                                                                 1917
I prefer not to say                                                                    0

RemoteWork                                          Remote  In-person  \
Not employed, and not looking for work                  85         17
Not employed, but looking for work                     432         73
Independent contractor, freelancer, or self-emp...    6333        901
Retired                                                 61         21
Employed, full-time                                  15852       9604
Student, full-time                                     856        755
Student, part-time                                     569        496
Employed, part-time                                   1210       1013
I prefer not to say                                      0          0

RemoteWork                                          Remote_frac
Not employed, and not looking for work                 0.658915
Not employed, but looking for work                     0.609309
Independent contractor, freelancer, or self-emp...     0.591703
Retired                                                0.504132
Employed, full-time                                    0.351135
Student, full-time                                     0.302473
Student, part-time                                     0.301537
Employed, part-time                                    0.292271
I prefer not to say                                         NaN
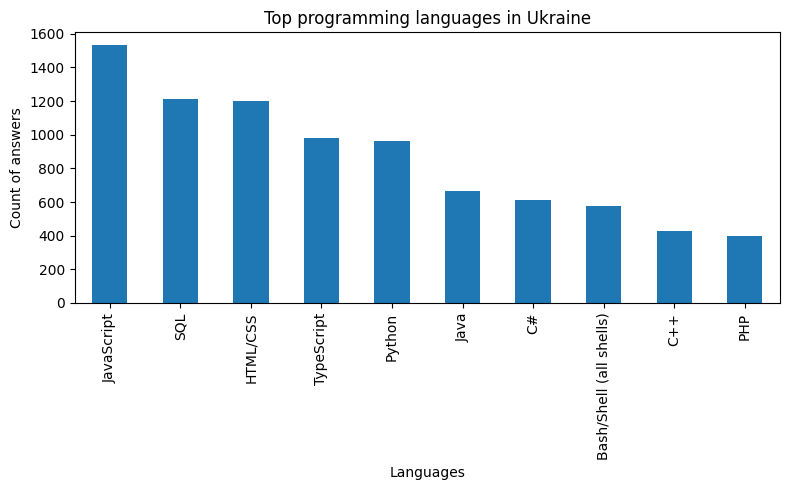
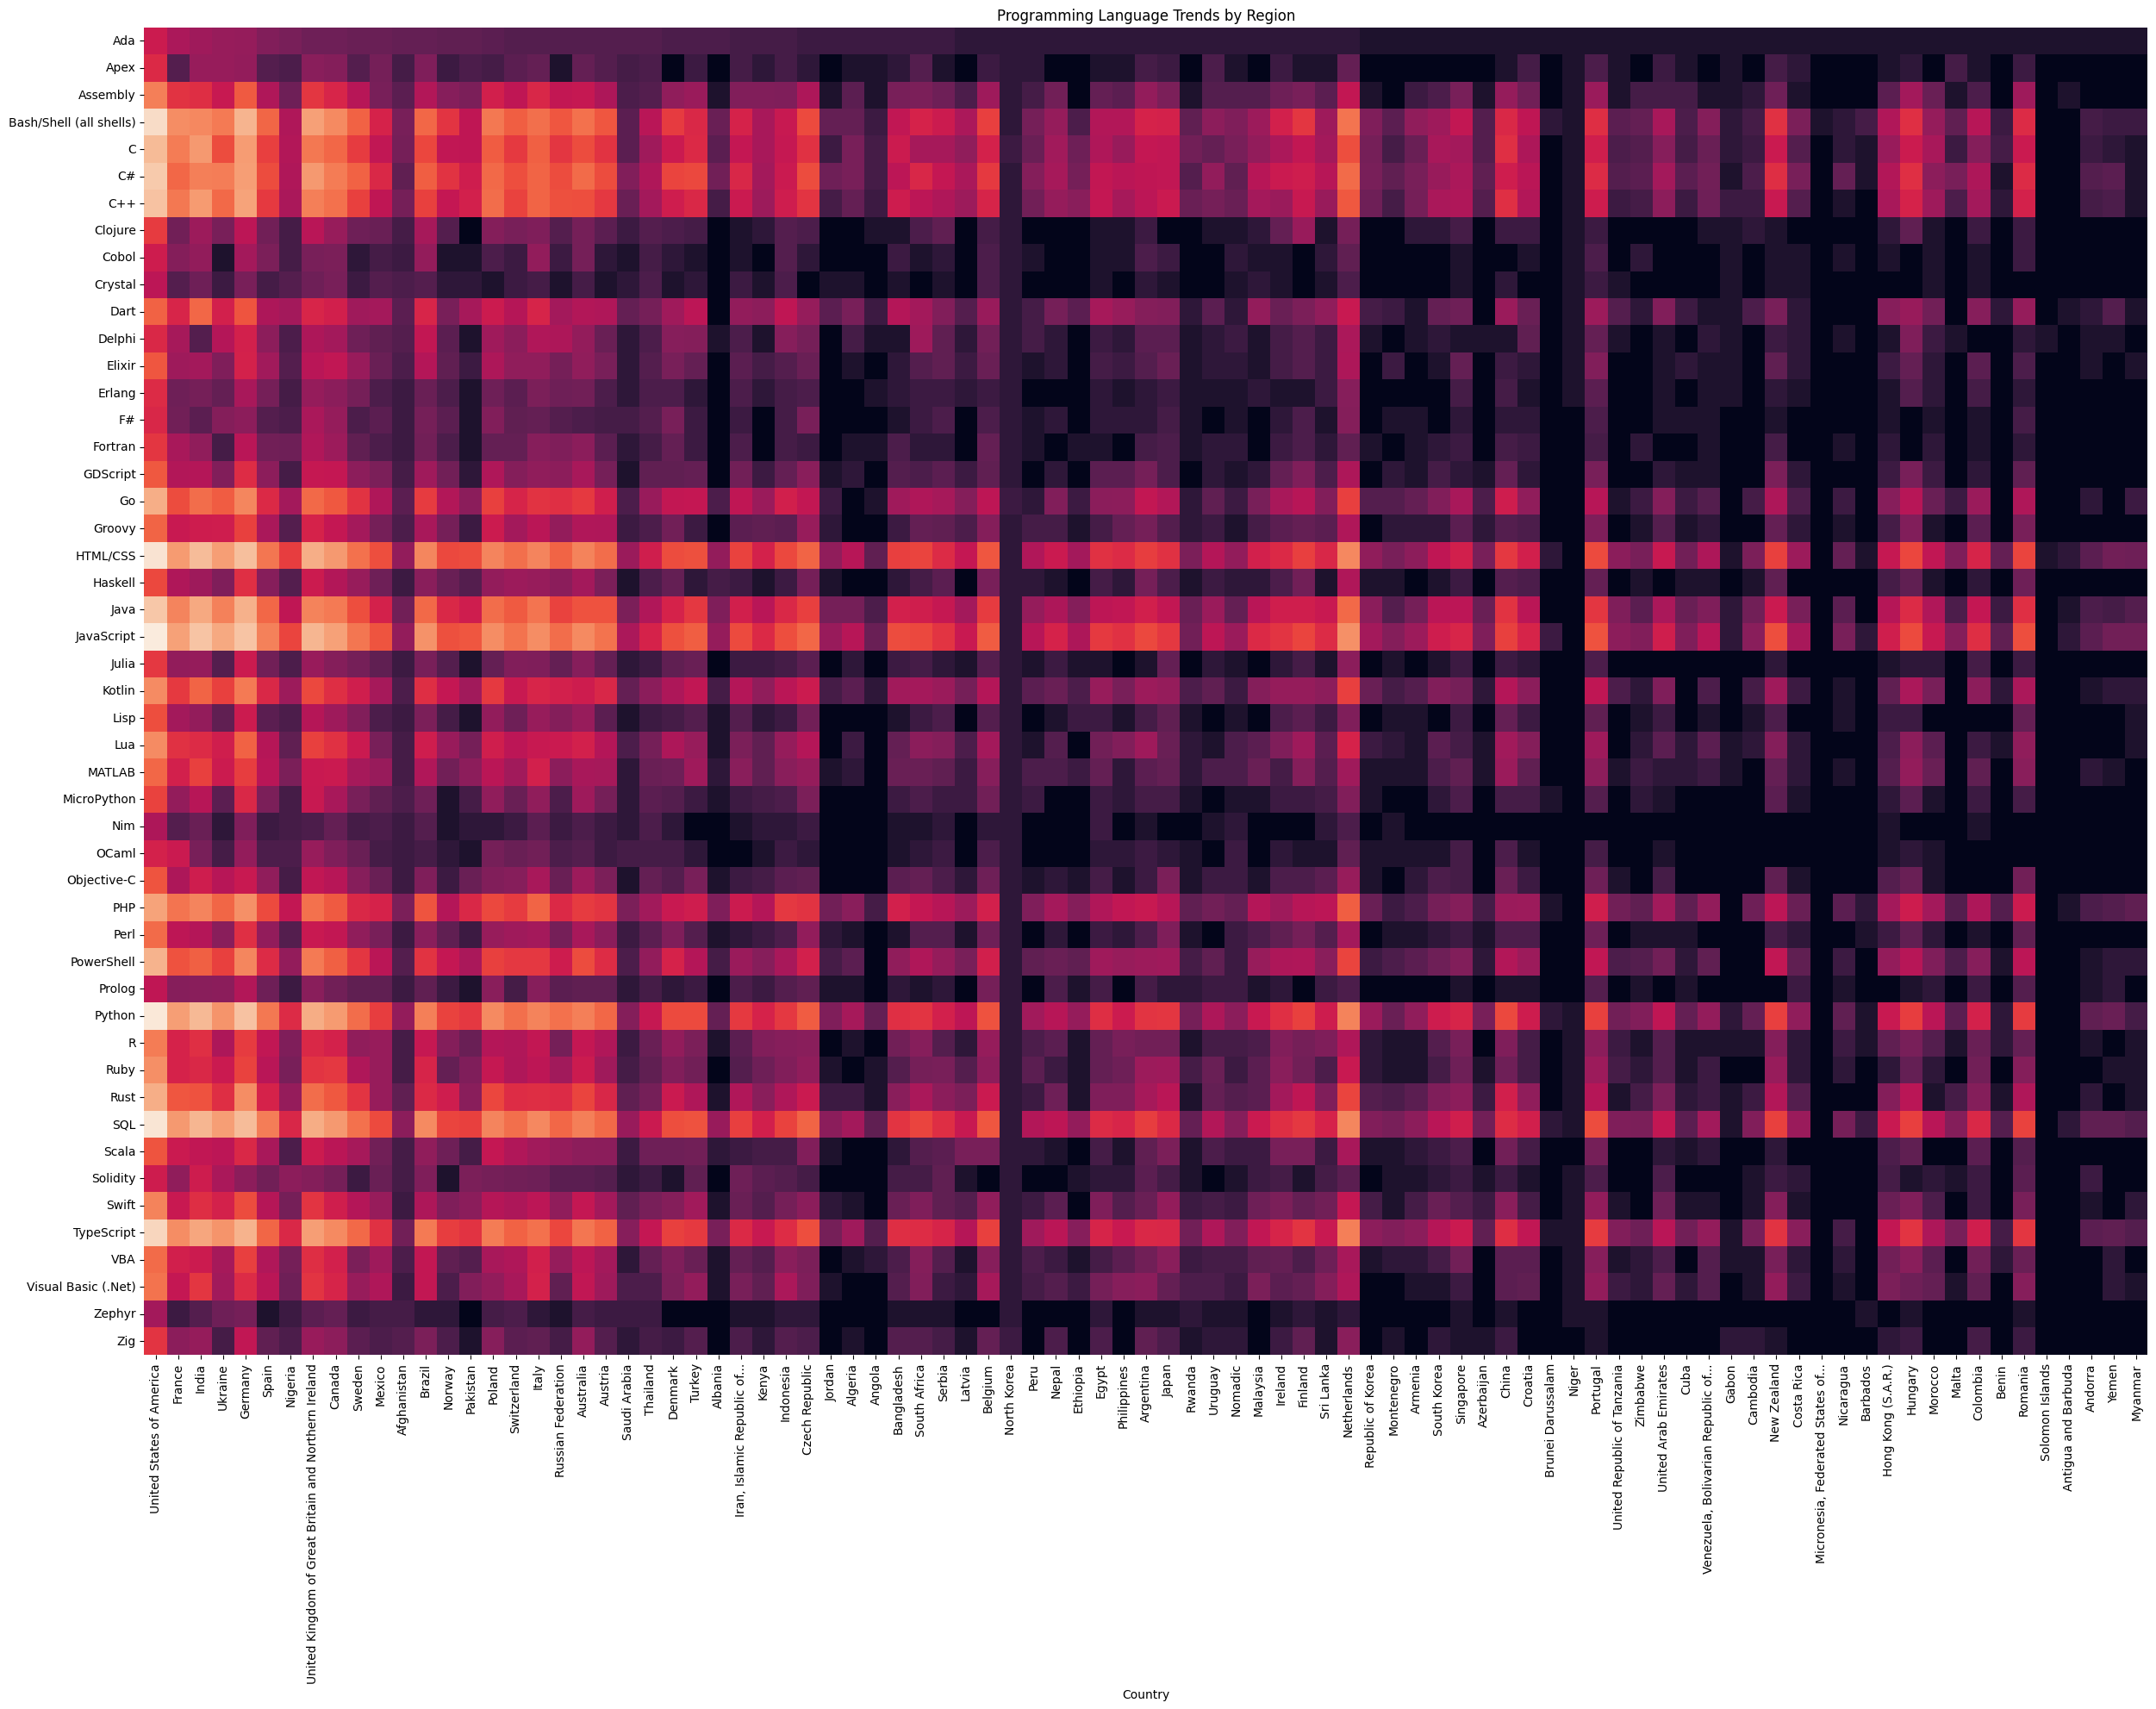
Step 7: Analyzing Programming Language Trends by Region
Analyze the popularity of programming languages by region. Use the LanguageHaveWorkedWith column to investigate which languages are most used in different regions.
-
Filter data by country or region.
-
Visualize the top programming languages by region with a bar plot or heatmap.
#Encode the LanguageHaveWorkedWith column using one-hot encoding
plr = df_me[['Country', 'LanguageHaveWorkedWith']].dropna()
cat = set()
lang = plr.LanguageHaveWorkedWith.unique()
for el in lang:
    if ';' in el:
        cat = cat | set(el.split(';'))
    else:
        cat.add(el)
cat = sorted(cat)
print(cat, len(cat))  # Columns that should be added to the dataframe
['Ada', 'Apex', 'Assembly', 'Bash/Shell (all shells)', 'C', 'C#', 'C++', 'Clojure', 'Cobol', 'Crystal', 'Dart', 'Delphi', 'Elixir', 'Erlang', 'F#', 'Fortran', 'GDScript', 'Go', 'Groovy', 'HTML/CSS', 'Haskell', 'Java', 'JavaScript', 'Julia', 'Kotlin', 'Lisp', 'Lua', 'MATLAB', 'MicroPython', 'Nim', 'OCaml', 'Objective-C', 'PHP', 'Perl', 'PowerShell', 'Prolog', 'Python', 'R', 'Ruby', 'Rust', 'SQL', 'Scala', 'Solidity', 'Swift', 'TypeScript', 'VBA', 'Visual Basic (.Net)', 'Zephyr', 'Zig'] 49
## Write your code here
plr = df_me[['Country', 'LanguageHaveWorkedWith']].dropna()
dummies = plr['LanguageHaveWorkedWith'].str.get_dummies(sep=';').astype(bool)
plr = pd.concat([plr, dummies], axis=1)
plr.shape
(57679, 51)
df_tab3 = pd.DataFrame()
for col in dummies.columns:
    df_tab3[col] = plr[plr[col]].Country.value_counts()
df_tab3 = df_tab3.fillna(0).astype(int).T

country = 'Ukraine'
plt.figure(figsize=(8, 5))
barpl = df_tab3[country].sort_values(ascending=False)
barpl = barpl.iloc[0:10]
ax = barpl.plot(kind='bar')
plt.title(f"Top programming languages in {country}")
plt.xlabel("Languages")
plt.ylabel("Count of answers")
plt.tight_layout()
plt.show()
#df_tab3fr = df_tab3.div(df_tab3.sum(axis=0), axis=1) # column‑wise normalization
plt.figure(figsize=(30, 20))
sns.heatmap(np.log10(df_tab3 + 1), cbar=False)
#sns.heatmap(df_tab3fr, cbar=False)
plt.title("Programming Language Trends by Region")
plt.show()
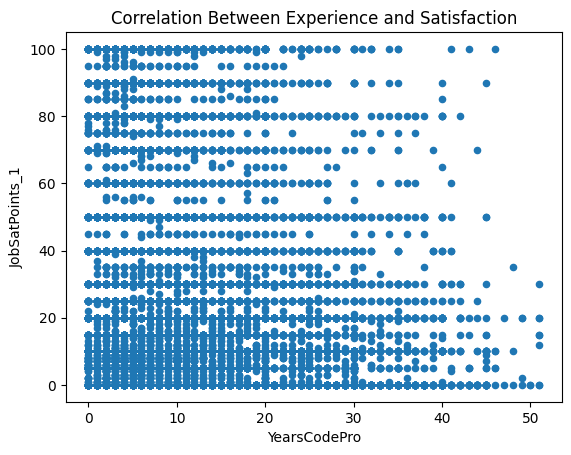
Step 8: Correlation Between Experience and Satisfaction
Examine how years of experience (YearsCodePro) correlate with job satisfaction (JobSatPoints_1). Use a scatter plot to visualize this relationship.
## Write your code here
df_cbes = df_me[['YearsCodePro', 'JobSatPoints_1']].dropna()
df_cbes = df_cbes.replace({'Less than 1 year': 0, 'More than 50 years': 51}).astype(int)
df_cbes.plot(kind='scatter', x='YearsCodePro', y='JobSatPoints_1')
plt.title('Correlation Between Experience and Satisfaction')
plt.ylabel('JobSatPoints_1')
plt.xlabel('YearsCodePro')
plt.show()
Step 9: Educational Background and Employment Type
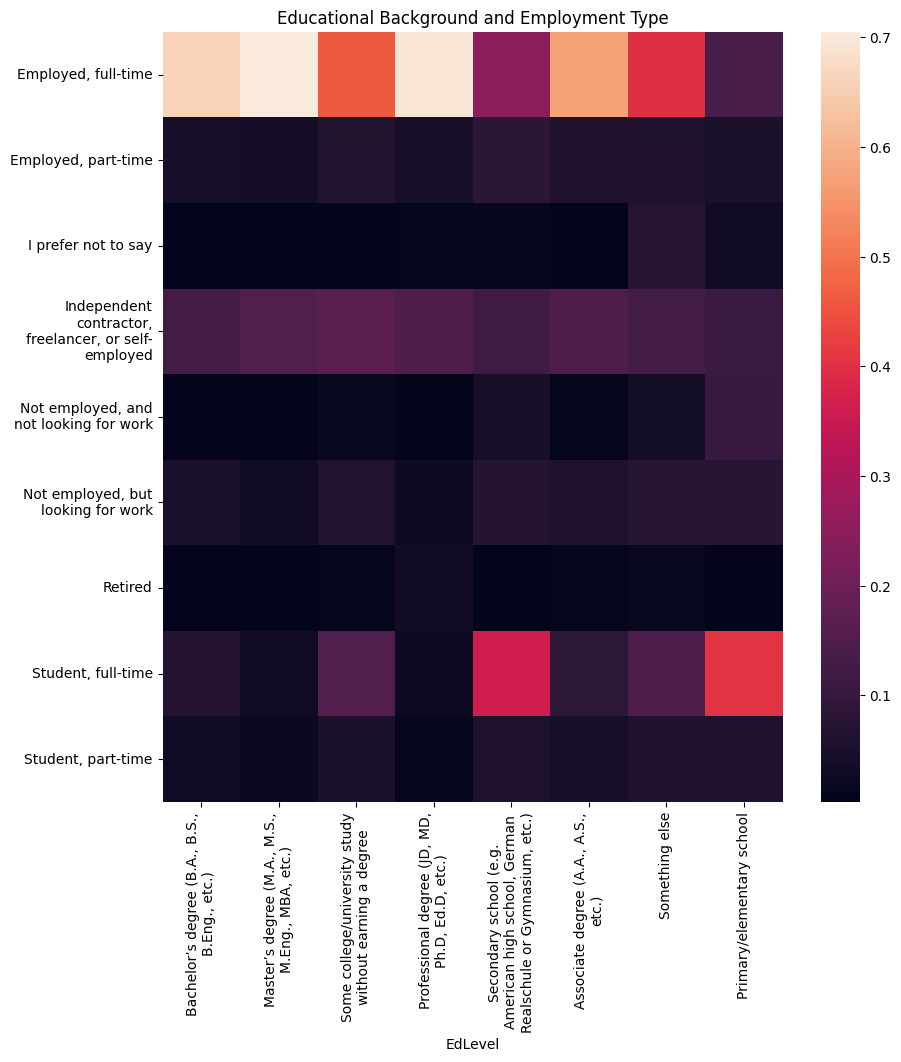
Explore how educational background (EdLevel) relates to employment type (Employment). Use cross-tabulation and visualizations to understand if higher education correlates with specific employment types.
print(df_me['EdLevel'].unique())
<StringArray>
[                                                         'Primary/elementary school',
                                       'Bachelor’s degree (B.A., B.S., B.Eng., etc.)',
                                    'Master’s degree (M.A., M.S., M.Eng., MBA, etc.)',
                             'Some college/university study without earning a degree',
 'Secondary school (e.g. American high school, German Realschule or Gymnasium, etc.)',
                                     'Professional degree (JD, MD, Ph.D, Ed.D, etc.)',
                                                'Associate degree (A.A., A.S., etc.)',
                                                                     'Something else',
                                                                                  nan]
Length: 9, dtype: str
## Write your code here
df_ebet = pd.DataFrame()
dummies = df_me['Employment'].str.get_dummies(sep=';').astype(bool)
for col in dummies.columns:
    df_ebet[col] = df_me[df_me[col]].EdLevel.value_counts()
df_ebet = df_ebet.T.fillna(0).astype(int)
print(df_ebet.info())
<class 'pandas.DataFrame'>
Index: 9 entries, Employed, full-time to Student, part-time
Data columns (total 8 columns):
 #   Column                                                                              Non-Null Count  Dtype
---  ------                                                                              --------------  -----
 0   Bachelor’s degree (B.A., B.S., B.Eng., etc.)                                        9 non-null      int64
 1   Master’s degree (M.A., M.S., M.Eng., MBA, etc.)                                     9 non-null      int64
 2   Some college/university study without earning a degree                              9 non-null      int64
 3   Professional degree (JD, MD, Ph.D, Ed.D, etc.)                                      9 non-null      int64
 4   Secondary school (e.g. American high school, German Realschule or Gymnasium, etc.)  9 non-null      int64
 5   Associate degree (A.A., A.S., etc.)                                                 9 non-null      int64
 6   Something else                                                                      9 non-null      int64
 7   Primary/elementary school                                                           9 non-null      int64
dtypes: int64(8)
memory usage: 648.0+ bytes
None
df_ebetfr = df_ebet.div(df_ebet.sum(axis=0), axis=1) # column‑wise normalization
plt.figure(figsize=(10, 10))
ax = sns.heatmap(df_ebetfr)
xlabels = [textwrap.fill(label.get_text(), width=30) for label in ax.get_xticklabels()]
ylabels = [textwrap.fill(label.get_text(), width=20) for label in ax.get_yticklabels()]
ax.set(xticklabels=xlabels, yticklabels=ylabels)
plt.title("Educational Background and Employment Type")
plt.show()
Step 10: Save the Cleaned and Analyzed Dataset
After your analysis, save the modified dataset for further use or sharing.
## Write your code here
df_me.to_csv("Lab12out.csv", index=False)
Summary
In this revised lab, you:
-
Loaded and explored the structure of the dataset.
-
Handled missing data effectively.
-
Analyzed key variables, including working hours, job satisfaction, and remote work trends.
-
Investigated programming language usage by region and examined the relationship between experience and satisfaction.
-
Used cross-tabulation to understand educational background and employment type.
Copyright © IBM Corporation. All rights reserved.