
Finding Correlation
Estimated time needed: 30 minutes
In this lab, you will work with a cleaned dataset to perform exploratory data analysis (EDA). You will examine the distribution of the data, identify outliers, and determine the correlation between different columns in the dataset.
Objectives
In this lab, you will perform the following:
-
Identify the distribution of compensation data in the dataset.
-
Remove outliers to refine the dataset.
-
Identify correlations between various features in the dataset.
Hands on Lab
Step 1: Install and Import Required Libraries
# Install the necessary libraries
!pip install pandas
!pip install matplotlib
!pip install seaborn
!pip install scipy

# Import libraries
import pandas as pd
import matplotlib.pyplot as plt
import seaborn as sns
from scipy import stats
import textwrap
Collecting pandas
Downloading pandas-3.0.0-cp312-cp312-manylinux_2_24_x86_64.manylinux_2_28_x86_64.whl.metadata (79 kB)
Collecting numpy>=1.26.0 (from pandas)
Downloading numpy-2.4.2-cp312-cp312-manylinux_2_27_x86_64.manylinux_2_28_x86_64.whl.metadata (6.6 kB)
Requirement already satisfied: python-dateutil>=2.8.2 in /opt/conda/lib/python3.12/site-packages (from pandas) (2.9.0.post0)
Requirement already satisfied: six>=1.5 in /opt/conda/lib/python3.12/site-packages (from python-dateutil>=2.8.2->pandas) (1.17.0)
Downloading pandas-3.0.0-cp312-cp312-manylinux_2_24_x86_64.manylinux_2_28_x86_64.whl (10.9 MB)
[2K [90m━━━━━━━━━━━━━━━━━━━━━━━━━━━━━━━━━━━━━━━━[0m [32m10.9/10.9 MB[0m [31m158.5 MB/s[0m eta [36m0:00:00[0m
[?25hDownloading numpy-2.4.2-cp312-cp312-manylinux_2_27_x86_64.manylinux_2_28_x86_64.whl (16.6 MB)
[2K [90m━━━━━━━━━━━━━━━━━━━━━━━━━━━━━━━━━━━━━━━━[0m [32m16.6/16.6 MB[0m [31m181.1 MB/s[0m eta [36m0:00:00[0m
Installing collected packages: numpy, pandas
Successfully installed numpy-2.4.2 pandas-3.0.0
Collecting matplotlib
Downloading matplotlib-3.10.8-cp312-cp312-manylinux2014_x86_64.manylinux_2_17_x86_64.whl.metadata (52 kB)
Collecting contourpy>=1.0.1 (from matplotlib)
Downloading contourpy-1.3.3-cp312-cp312-manylinux_2_27_x86_64.manylinux_2_28_x86_64.whl.metadata (5.5 kB)
Collecting cycler>=0.10 (from matplotlib)
Downloading cycler-0.12.1-py3-none-any.whl.metadata (3.8 kB)
Collecting fonttools>=4.22.0 (from matplotlib)
Downloading fonttools-4.61.1-cp312-cp312-manylinux1_x86_64.manylinux2014_x86_64.manylinux_2_17_x86_64.manylinux_2_5_x86_64.whl.metadata (114 kB)
Collecting kiwisolver>=1.3.1 (from matplotlib)
Downloading kiwisolver-1.4.9-cp312-cp312-manylinux2014_x86_64.manylinux_2_17_x86_64.whl.metadata (6.3 kB)
Requirement already satisfied: numpy>=1.23 in /opt/conda/lib/python3.12/site-packages (from matplotlib) (2.4.2)
Requirement already satisfied: packaging>=20.0 in /opt/conda/lib/python3.12/site-packages (from matplotlib) (24.2)
Collecting pillow>=8 (from matplotlib)
Downloading pillow-12.1.0-cp312-cp312-manylinux_2_27_x86_64.manylinux_2_28_x86_64.whl.metadata (8.8 kB)
Collecting pyparsing>=3 (from matplotlib)
Downloading pyparsing-3.3.2-py3-none-any.whl.metadata (5.8 kB)
Requirement already satisfied: python-dateutil>=2.7 in /opt/conda/lib/python3.12/site-packages (from matplotlib) (2.9.0.post0)
Requirement already satisfied: six>=1.5 in /opt/conda/lib/python3.12/site-packages (from python-dateutil>=2.7->matplotlib) (1.17.0)
Downloading matplotlib-3.10.8-cp312-cp312-manylinux2014_x86_64.manylinux_2_17_x86_64.whl (8.7 MB)
[2K [90m━━━━━━━━━━━━━━━━━━━━━━━━━━━━━━━━━━━━━━━━[0m [32m8.7/8.7 MB[0m [31m156.2 MB/s[0m eta [36m0:00:00[0m
Downloading contourpy-1.3.3-cp312-cp312-manylinux_2_27_x86_64.manylinux_2_28_x86_64.whl (362 kB)
Downloading cycler-0.12.1-py3-none-any.whl (8.3 kB)
Downloading fonttools-4.61.1-cp312-cp312-manylinux1_x86_64.manylinux2014_x86_64.manylinux_2_17_x86_64.manylinux_2_5_x86_64.whl (5.0 MB)
[2K [90m━━━━━━━━━━━━━━━━━━━━━━━━━━━━━━━━━━━━━━━━[0m [32m5.0/5.0 MB[0m [31m170.1 MB/s[0m eta [36m0:00:00[0m
[?25hDownloading kiwisolver-1.4.9-cp312-cp312-manylinux2014_x86_64.manylinux_2_17_x86_64.whl (1.5 MB)
[2K [90m━━━━━━━━━━━━━━━━━━━━━━━━━━━━━━━━━━━━━━━━[0m [32m1.5/1.5 MB[0m [31m97.1 MB/s[0m eta [36m0:00:00[0m
[?25hDownloading pillow-12.1.0-cp312-cp312-manylinux_2_27_x86_64.manylinux_2_28_x86_64.whl (7.0 MB)
[2K [90m━━━━━━━━━━━━━━━━━━━━━━━━━━━━━━━━━━━━━━━━[0m [32m7.0/7.0 MB[0m [31m185.8 MB/s[0m eta [36m0:00:00[0m
[?25hDownloading pyparsing-3.3.2-py3-none-any.whl (122 kB)
Installing collected packages: pyparsing, pillow, kiwisolver, fonttools, cycler, contourpy, matplotlib
Successfully installed contourpy-1.3.3 cycler-0.12.1 fonttools-4.61.1 kiwisolver-1.4.9 matplotlib-3.10.8 pillow-12.1.0 pyparsing-3.3.2
Collecting seaborn
Downloading seaborn-0.13.2-py3-none-any.whl.metadata (5.4 kB)
Requirement already satisfied: numpy!=1.24.0,>=1.20 in /opt/conda/lib/python3.12/site-packages (from seaborn) (2.4.2)
Requirement already satisfied: pandas>=1.2 in /opt/conda/lib/python3.12/site-packages (from seaborn) (3.0.0)
Requirement already satisfied: matplotlib!=3.6.1,>=3.4 in /opt/conda/lib/python3.12/site-packages (from seaborn) (3.10.8)
Requirement already satisfied: contourpy>=1.0.1 in /opt/conda/lib/python3.12/site-packages (from matplotlib!=3.6.1,>=3.4->seaborn) (1.3.3)
Requirement already satisfied: cycler>=0.10 in /opt/conda/lib/python3.12/site-packages (from matplotlib!=3.6.1,>=3.4->seaborn) (0.12.1)
Requirement already satisfied: fonttools>=4.22.0 in /opt/conda/lib/python3.12/site-packages (from matplotlib!=3.6.1,>=3.4->seaborn) (4.61.1)
Requirement already satisfied: kiwisolver>=1.3.1 in /opt/conda/lib/python3.12/site-packages (from matplotlib!=3.6.1,>=3.4->seaborn) (1.4.9)
Requirement already satisfied: packaging>=20.0 in /opt/conda/lib/python3.12/site-packages (from matplotlib!=3.6.1,>=3.4->seaborn) (24.2)
Requirement already satisfied: pillow>=8 in /opt/conda/lib/python3.12/site-packages (from matplotlib!=3.6.1,>=3.4->seaborn) (12.1.0)
Requirement already satisfied: pyparsing>=3 in /opt/conda/lib/python3.12/site-packages (from matplotlib!=3.6.1,>=3.4->seaborn) (3.3.2)
Requirement already satisfied: python-dateutil>=2.7 in /opt/conda/lib/python3.12/site-packages (from matplotlib!=3.6.1,>=3.4->seaborn) (2.9.0.post0)
Requirement already satisfied: six>=1.5 in /opt/conda/lib/python3.12/site-packages (from python-dateutil>=2.7->matplotlib!=3.6.1,>=3.4->seaborn) (1.17.0)
Downloading seaborn-0.13.2-py3-none-any.whl (294 kB)
Installing collected packages: seaborn
Successfully installed seaborn-0.13.2
Collecting scipy
Downloading scipy-1.17.0-cp312-cp312-manylinux_2_27_x86_64.manylinux_2_28_x86_64.whl.metadata (62 kB)
Requirement already satisfied: numpy<2.7,>=1.26.4 in /opt/conda/lib/python3.12/site-packages (from scipy) (2.4.2)
Downloading scipy-1.17.0-cp312-cp312-manylinux_2_27_x86_64.manylinux_2_28_x86_64.whl (35.0 MB)
[2K [90m━━━━━━━━━━━━━━━━━━━━━━━━━━━━━━━━━━━━━━━━[0m [32m35.0/35.0 MB[0m [31m125.0 MB/s[0m eta [36m0:00:00[0m00:01[0m
Installing collected packages: scipy
Successfully installed scipy-1.17.0
Step 2: Load the Dataset
# Load the dataset from the given URL
file_url = "https://cf-courses-data.s3.us.cloud-object-storage.appdomain.cloud/n01PQ9pSmiRX6520flujwQ/survey-data.csv"
df = pd.read_csv(file_url)

# Display the first few rows to understand the structure of the dataset
print(df.head())
print('Initial dataframe:', df.shape)
   ResponseId                      MainBranch                 Age  \
0           1  I am a developer by profession  Under 18 years old
1           2  I am a developer by profession     35-44 years old
2           3  I am a developer by profession     45-54 years old
3           4           I am learning to code     18-24 years old
4           5  I am a developer by profession     18-24 years old

            Employment RemoteWork   Check  \
0  Employed, full-time     Remote  Apples
1  Employed, full-time     Remote  Apples
2  Employed, full-time     Remote  Apples
3   Student, full-time        NaN  Apples
4   Student, full-time        NaN  Apples

                                    CodingActivities  \
0                                              Hobby
1  Hobby;Contribute to open-source projects;Other...
2  Hobby;Contribute to open-source projects;Other...
3                                                NaN
4                                                NaN

                                             EdLevel  \
0                          Primary/elementary school
1       Bachelor’s degree (B.A., B.S., B.Eng., etc.)
2    Master’s degree (M.A., M.S., M.Eng., MBA, etc.)
3  Some college/university study without earning ...
4  Secondary school (e.g. American high school, G...

                                           LearnCode  \
0                             Books / Physical media
1  Books / Physical media;Colleague;On the job tr...
2  Books / Physical media;Colleague;On the job tr...
3  Other online resources (e.g., videos, blogs, f...
4  Other online resources (e.g., videos, blogs, f...

                                     LearnCodeOnline  ... JobSatPoints_6  \
0                                                NaN  ...            NaN
1  Technical documentation;Blogs;Books;Written Tu...  ...            0.0
2  Technical documentation;Blogs;Books;Written Tu...  ...            NaN
3  Stack Overflow;How-to videos;Interactive tutorial  ...            NaN
4  Technical documentation;Blogs;Written Tutorial...  ...            NaN

  JobSatPoints_7 JobSatPoints_8 JobSatPoints_9 JobSatPoints_10  \
0            NaN            NaN            NaN             NaN
1            0.0            0.0            0.0             0.0
2            NaN            NaN            NaN             NaN
3            NaN            NaN            NaN             NaN
4            NaN            NaN            NaN             NaN

  JobSatPoints_11           SurveyLength SurveyEase ConvertedCompYearly JobSat
0             NaN                    NaN        NaN                 NaN    NaN
1             0.0                    NaN        NaN                 NaN    NaN
2             NaN  Appropriate in length       Easy                 NaN    NaN
3             NaN               Too long       Easy                 NaN    NaN
4             NaN              Too short       Easy                 NaN    NaN

[5 rows x 114 columns]
Initial dataframe: (65437, 114)
Step 3: Analyze and Visualize Compensation Distribution
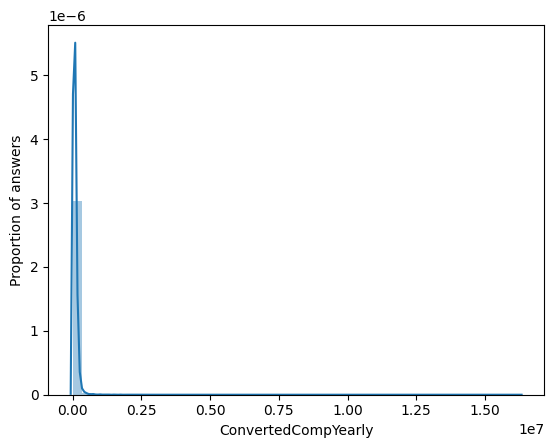
Task: Plot the distribution and histogram for ConvertedCompYearly to examine the spread of yearly compensation among respondents.
## Write your code here
ax = sns.distplot(df.ConvertedCompYearly, hist=True)
plt.ylabel('Proportion of answers')
plt.show()
/tmp/ipykernel_300/3941491017.py:2: UserWarning:

`distplot` is a deprecated function and will be removed in seaborn v0.14.0.

Please adapt your code to use either `displot` (a figure-level function with
similar flexibility) or `histplot` (an axes-level function for histograms).

For a guide to updating your code to use the new functions, please see
https://gist.github.com/mwaskom/de44147ed2974457ad6372750bbe5751

  ax = sns.distplot(df.ConvertedCompYearly, hist=True)
Step 4: Calculate Median Compensation for Full-Time Employees
Task: Filter the data to calculate the median compensation for respondents whose employment status is "Employed, full-time."
## Write your code here
df[df.Employment == 'Employed, full-time'].ConvertedCompYearly.median()
np.float64(69814.0)
Step 5: Analyzing Compensation Range and Distribution by Country
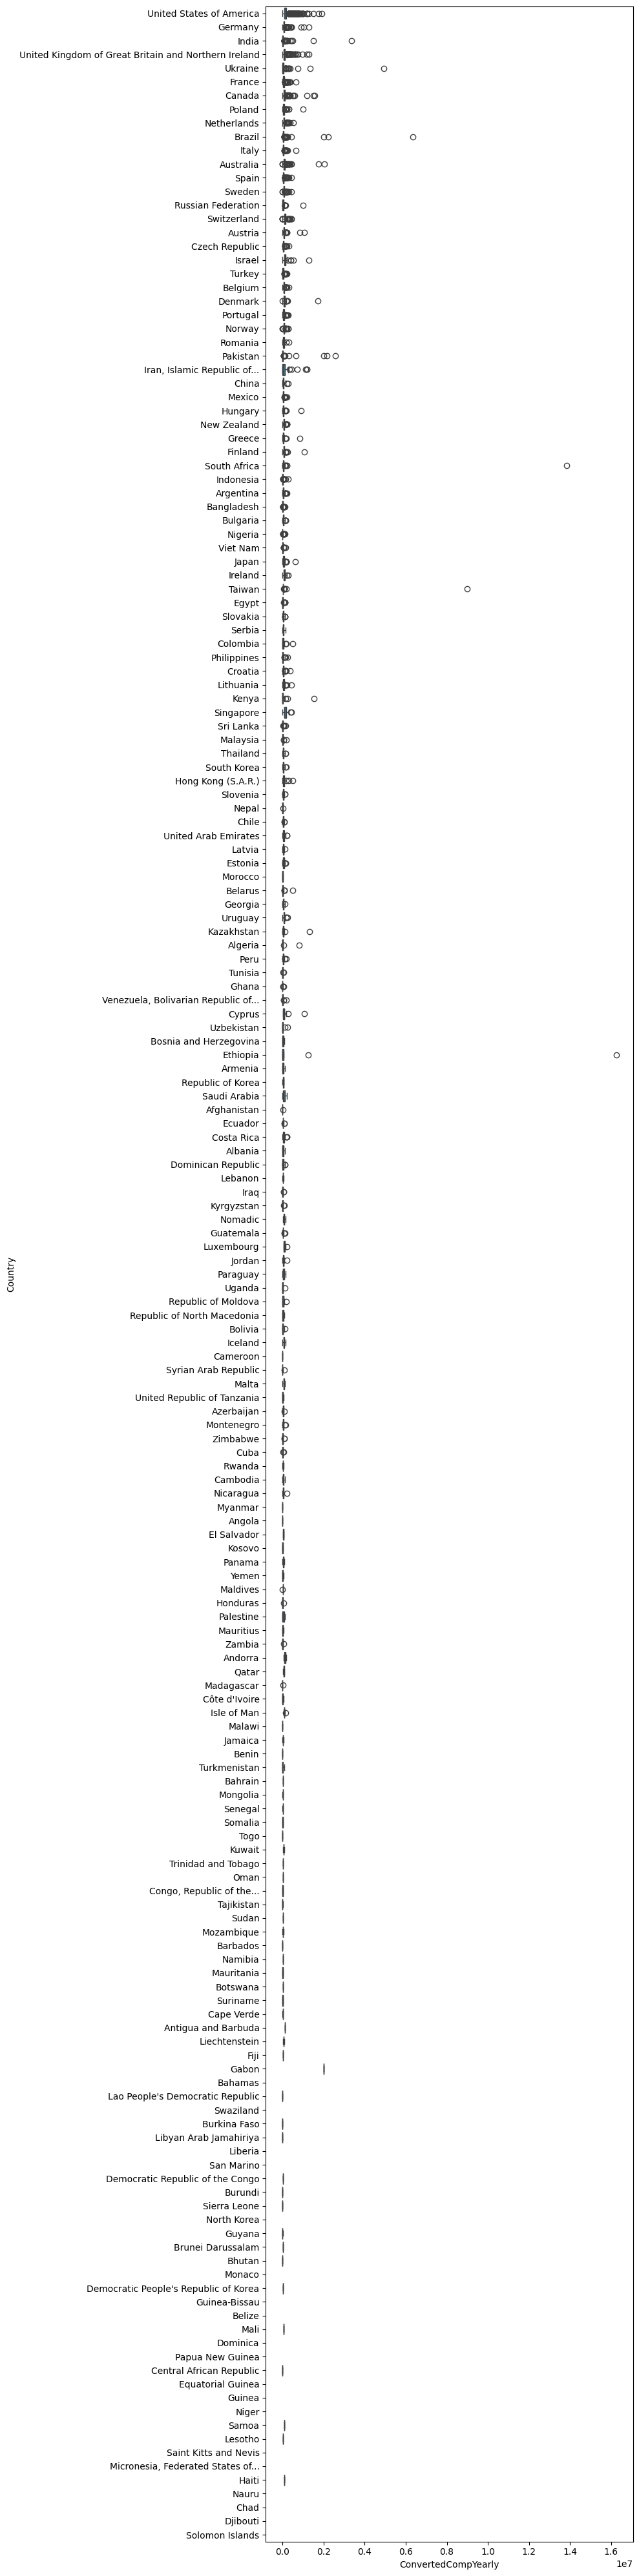
Explore the range of compensation in the ConvertedCompYearly column by analyzing differences across countries. Use box plots to compare the compensation distributions for each country to identify variations and anomalies within each region, providing insights into global compensation trends.
## Write your code here
order = df.Country.value_counts().index
plt.figure(figsize=(10, 40))
sns.boxplot(data=df, x='ConvertedCompYearly', y='Country', order=order)
plt.tight_layout()
plt.show()
Step 6: Removing Outliers from the Dataset
Task: Create a new DataFrame by removing outliers from the ConvertedCompYearly column to get a refined dataset for correlation analysis.
## Write your code here
doc = df.ConvertedCompYearly
q1, q3 = doc.quantile(.25), doc.quantile(.75)
iqr = q3 - q1
outliers1 = doc[(doc > q3 + 1.5 * iqr) | (doc < q1 - 1.5 * iqr)].sort_values(ascending=False)
print('Number of outliers in ConvertedCompYearly:', outliers1.count())
Number of outliers in ConvertedCompYearly: 978
df_o = df[~df['ConvertedCompYearly'].isin(outliers1)]
df_o['ConvertedCompYearly'].describe()
count     22457.000000
mean      71347.201897
std       51271.396445
min           1.000000
25%       32000.000000
50%       63694.000000
75%      101281.000000
max      220207.000000
Name: ConvertedCompYearly, dtype: float64
Step 7: Finding Correlations Between Key Variables
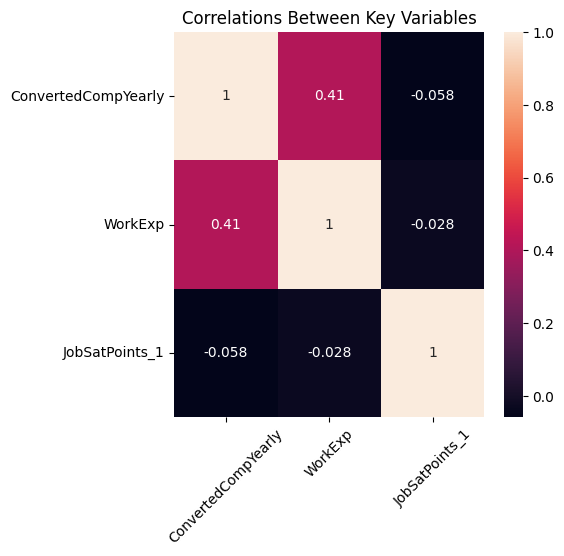
Task: Calculate correlations between ConvertedCompYearly, WorkExp, and JobSatPoints_1. Visualize these correlations with a heatmap.
## Write your code here
df_corr = df_o[['ConvertedCompYearly', 'WorkExp', 'JobSatPoints_1']].corr()

plt.figure(figsize=(5, 5))
sns.heatmap(df_corr, annot=True)
plt.xticks(rotation=45)
plt.yticks(rotation=0)
plt.title('Correlations Between Key Variables')
plt.show()
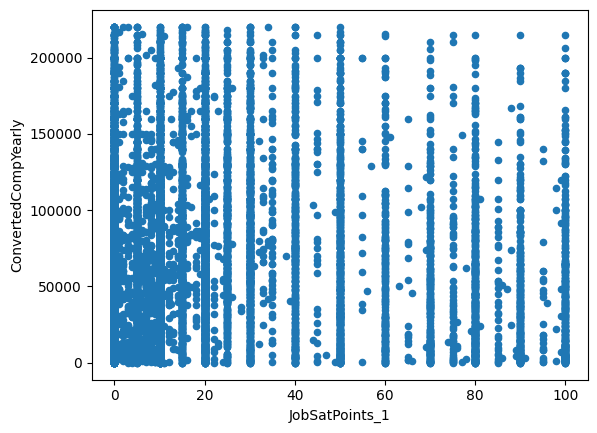
Step 8: Scatter Plot for Correlations
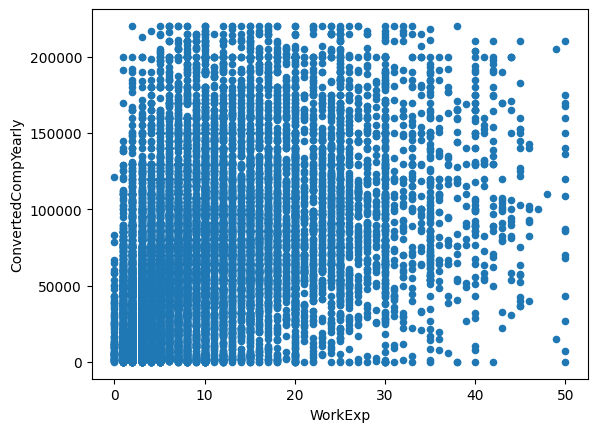
Task: Create scatter plots to examine specific correlations between ConvertedCompYearly and WorkExp, as well as between ConvertedCompYearly and JobSatPoints_1.
## Write your code here
df_o.plot.scatter(x='WorkExp', y='ConvertedCompYearly')
<Axes: xlabel='WorkExp', ylabel='ConvertedCompYearly'>
df_o.plot.scatter(x='JobSatPoints_1', y='ConvertedCompYearly')
<Axes: xlabel='JobSatPoints_1', ylabel='ConvertedCompYearly'>
Summary
In this lab, you practiced essential skills in correlation analysis by:
- Examining the distribution of yearly compensation with histograms and box plots.
- Detecting and removing outliers from compensation data.
- Calculating correlations between key variables such as compensation, work experience, and job satisfaction.
- Visualizing relationships with scatter plots and heatmaps to gain insights into the associations between these features.
By following these steps, you have developed a solid foundation for analyzing relationships within the dataset.
Authors:
Ayushi Jain
Other Contributors:
- Rav Ahuja
- Lakshmi Holla
- Malika
Copyright © IBM Corporation. All rights reserved.