Timilsina-FOXM1-Manuscript-Figs /
MainFigures.md
MainFigures.md
Timilsina et al figures
Nourhan Abdelfattah 2024-04-26
library(easypackages)
MyPackages<-c("dplyr","ggplot2","ggpubr","gridExtra","viridis","egg","presto","ComplexHeatmap",
              "Seurat","cowplot","patchwork","stringr", "ggmin","SingleCellExperiment","CellChat")
libraries(MyPackages)


SeuratObj=readRDS(paste0(RobjDirectory,"SantoshAllClustersnew.rds"))
SeuratObjT=readRDS(paste0(RobjDirectory,"TandNKcellsonlyNew.rds"))

##color palettes needed
SampleColors=c(Ctrl = "#003F5C", KO_1 = "#E46388", KO_3 = "#8DB032")
ClusterColors=c(C01 = "#8DB032", C02 = "#61AA4F", C03 = "#60AD62", C04 = "#C9C759",
                C05 = "#F8C238", C06 = "#FEA905", C07 = "#FF9022", C08 = "#FB7B3E",
                C09 = "#E97B25", C10 = "#E6722E", C11 = "#F5615E", C12 = "#DE4F56",
                C13 = "#BE3F40", C14 = "#DF606C", C15 = "#EE6E88", C16 = "#DA5787",
                C17 = "#D8629C", C18 = "#DF80BE", C19 = "#BC66A8", C20 = "#9F559B",
                C21 = "#9E68B9", C22 = "#8C67B6", C23 = "#6B5496", C24 = "#4566B1",
                C25 = "#227ACD", C26 = "#2A5C9A", C27 = "#235982", C28 = "#087C91",
                C29 = "#00697E", C30 = "#003F5C")
AssignmentColors=c(BCells = "#003F5C", Blood = "#0A7A90", CAFs = "#2960A1", DCs = "#4D61A8",
                   Epithelial = "#956CBF", Macs = "#A45498", Mastcells = "#DC73B0",
                   Monocytes = "#E46388", Myeloid_Prog = "#CD4E53", Neutrophils = "#F45A66",
                   NKcells = "#E47B1E", Plasmablast = "#FF8B2B", Tcells = "#F9BF31",
                   Tumor = "#68AF61", Vasc = "#8DB032")
TAssignmentColors=c(`Activated TCells` = "#003F5C", `CD4+ TCells` = "#205D83",
`CD8+ TCells` = "#3D6BB9", doublet = "#9E6DC1", `Effector CD4+ TCells` = "#D378B8",
`Effector Memory` = "#E46388", `Exhasted CD8+ TCells` = "#C94446",
`Naiive TCells-CD8+` = "#E27820", NKcells = "#FF951A", `Proliferating TCells` = "#BFC45A",
Treg = "#8DB032")
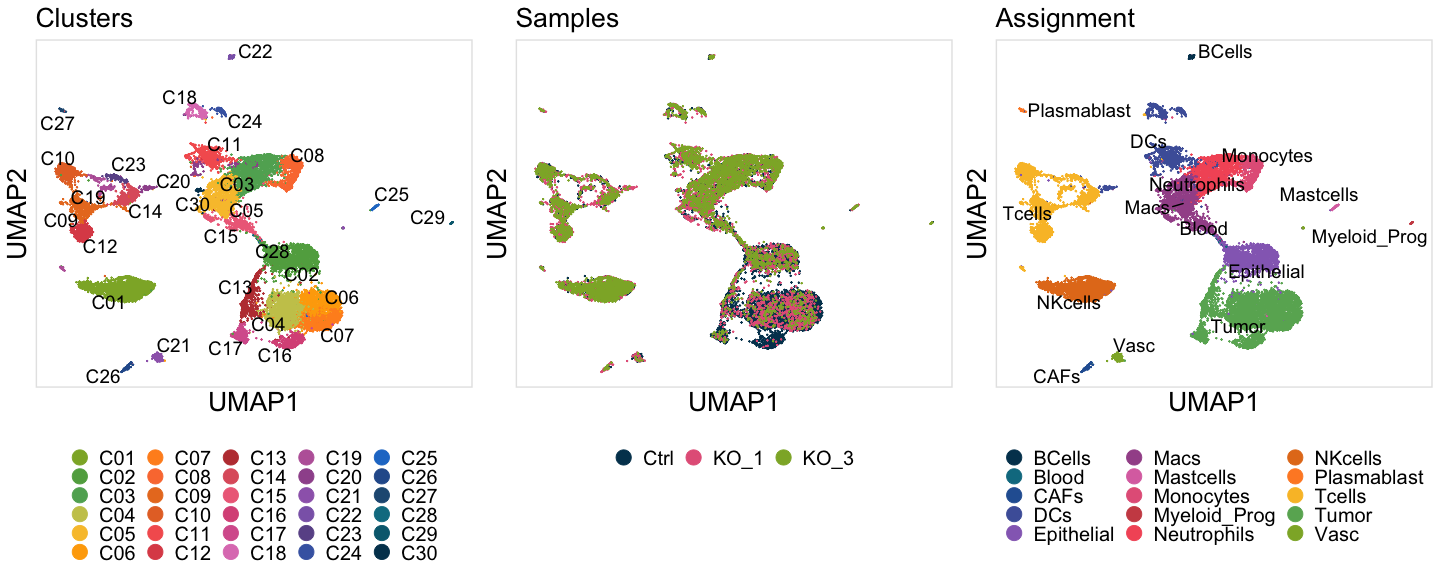
Figure 3
U1=DimPlot(SeuratObj, reduction = "umap",group.by = "Cluster" ,cols =  ClusterColors,label=F)+ggmin::theme_min()+
  scale_y_continuous(breaks=NULL)+scale_x_continuous(breaks=NULL)+ xlab("UMAP1") + ylab("UMAP2")+
  FontSize(x.title = 20, y.title = 20,main = 20)+ theme(legend.position = "bottom")+labs(title="Clusters")+
  guides(colour = guide_legend(override.aes = list(size=5),title.theme = element_text(size=15, face="bold"),title.position = "top",label.theme = element_text(size=15),ncol = 5))
U1=LabelClusters(U1, id = "Cluster", size=5,repel = T)

U2=DimPlot(SeuratObj, reduction = "umap",group.by = "Sample",cols = SampleColors )+ggmin::theme_min()+
  scale_y_continuous(breaks=NULL)+scale_x_continuous(breaks=NULL)+ xlab("UMAP1") + ylab("UMAP2")+
  FontSize(x.title = 20, y.title = 20,main = 20)+ theme(legend.position = "bottom")+labs(title="Samples")+
  guides(colour = guide_legend(override.aes = list(size=5),title.theme = element_text(size=15, face="bold"),title.position = "top",label.theme = element_text(size=15),ncol = 3))

U3=DimPlot(SeuratObj, reduction = "umap",group.by = "Assignment" ,cols =  AssignmentColors,label=F)+ggmin::theme_min()+
  scale_y_continuous(breaks=NULL)+scale_x_continuous(breaks=NULL)+ xlab("UMAP1") + ylab("UMAP2")+
  FontSize(x.title = 20, y.title = 20,main = 20)+ theme(legend.position = "bottom",strip.text = element_text(size=1))+labs(title="Assignment")+
  guides(colour = guide_legend(override.aes = list(size=5),title.theme = element_text(size=15, face="bold"),
                               title.position = "top",label.theme = element_text(size=15),ncol = 3))

U3=LabelClusters(U3, id = "Assignment", size=5,repel = T)

plots2=ggarrange(U1,U2,U3,ncol = 3)
pdf(paste0(OutputDirectory,"Figure 3a All UMAPs.pdf"),width = 15,height = 6)
print(plots2)
dev.off()
## quartz_off_screen
##                 2
roundUpNice <- function(x, nice=c(1,2,3,4,5,6,7,8,9,10)) {
if(length(x) != 1) stop("'x' must be of length 1")
10^floor(log10(x)) * nice[[which(x <= 10^floor(log10(x)) * nice)[[1]]]]
}
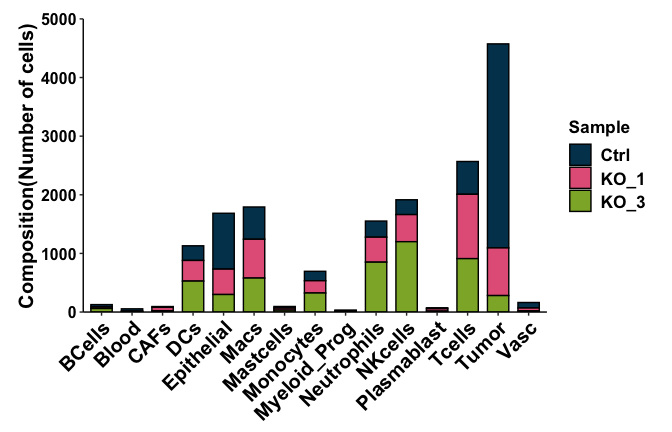
MaxA=max(as.matrix(table(SeuratObj@meta.data$Assignment)))
HeightA=roundUpNice(MaxA)
P7=SeuratObj@meta.data %>% ggplot(aes(x=Assignment, fill=Sample)) +scale_fill_manual(values = SampleColors)+
geom_bar(color="black",width = 0.7) +
theme(panel.grid.major = element_blank(), panel.grid.minor = element_blank(),panel.background = element_blank(), legend.text = element_text(color="black",size=13,face = "bold"),legend.title = element_text(color="black",size=13,face = "bold"),
axis.line = element_line(colour = "black"), axis.text.y = element_text(color="black",size=12),axis.text.x = element_text(color="black",angle = 45,hjust = 1,size=15),
axis.text=element_text(size=15, face="bold"), axis.title=element_text(size=15,face="bold"),
plot.margin = unit(c(0.5, 0.5,0.2, 0.5),"cm"))+labs(y ="Composition(Number of cells)", x= NULL)+ scale_y_continuous(expand = c(0,0),limits = c(0,HeightA),breaks = seq(0, HeightA, by = 1000));P7
pdf(paste0(OutputDirectory, "Fig3b barplot.pdf"),width = 7,height = 4.5)
P7
dev.off()
## quartz_off_screen
##                 2
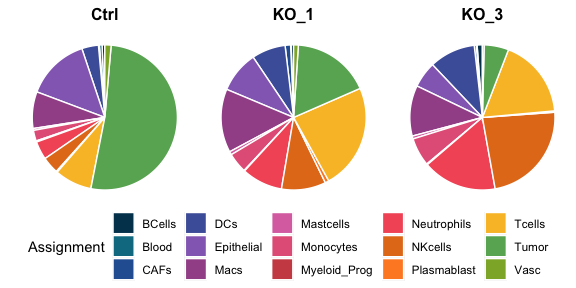
x1=ggplot(SeuratObj@meta.data, aes("", fill=Assignment))+geom_bar(stat="count",position="fill",colour = "white",width =0.7)+
  scale_fill_manual(values = AssignmentColors)+coord_polar("y",start=0) + facet_grid(~ Sample) + #labs(title=pat2[i])+
  theme(legend.position = "bottom",panel.grid.major = element_blank(), panel.grid.minor = element_blank(),axis.text=element_blank(),axis.ticks = element_blank(),
        panel.background = element_blank(), axis.title = element_blank(),strip.background=element_rect(fill="white"),
        strip.text=element_text(face = "bold",color = "black",size=12),plot.margin = unit(c(0,-0.2,-0.2,0),'cm'))

mylegend<-get_legend(x1)
plot=ggpubr::ggarrange(x1+NoLegend(),ncol =1,nrow = 1,
                  legend.grob = mylegend, legend="bottom") ;plot
pdf(file =paste(paste0(OutputDirectory,"Fig3c piechart.pdf")), height = 3, width =6,onefile = F)
print(plot)
dev.off()
## quartz_off_screen
##                 2
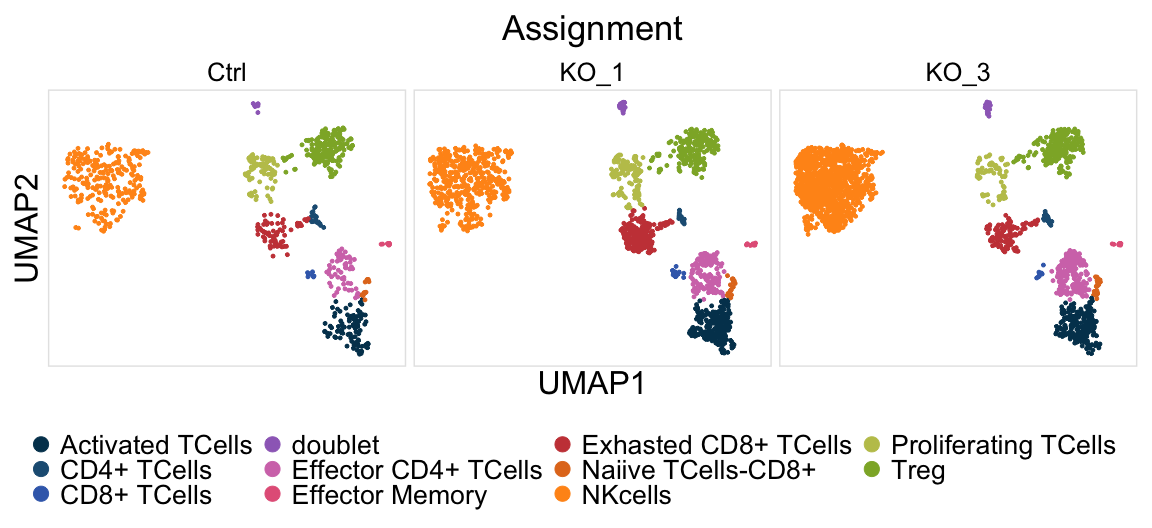
Fig4dPlot=DimPlot(SeuratObjT, reduction = "umap",group.by = "Assignment",cols =TAssignmentColors,split.by = "Sample",ncol = 3, pt.size = 1)+ggmin::theme_min()+
  scale_y_continuous(breaks=NULL)+scale_x_continuous(breaks=NULL)+ xlab("UMAP1") + ylab("UMAP2")+theme(strip.text = element_text(size=16)) +
  FontSize(x.title = 24, y.title = 24,main = 26)+ theme(legend.position = "bottom")+labs(title="Assignment")+ theme(plot.title = element_text(hjust = 0.5)) +
  guides(colour = guide_legend(override.aes = list(size=5),title.theme = element_text(size=15, face="bold"),title.position = "top",label.theme = element_text(size=20),ncol = ceiling(length(levels(as.factor(SeuratObjT$Cluster)))/3)));Fig4dPlot
pdf(paste0(OutputDirectory,"Fig3 d tcell umap by sample.pdf"),width = 12,height =5.5)
print(Fig4dPlot)
dev.off()
## quartz_off_screen
##                 2
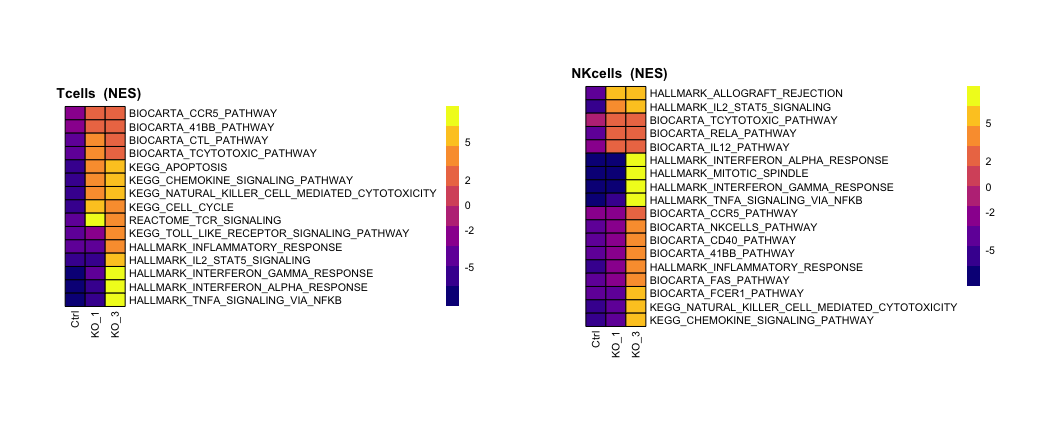
#loading and filtering GSEA analysis results before plotting
#GSEA analysis were performed using fGSEA on DEGs generated by presto::wilcoxauc()
folder=PathwayOutputFolder
setwd(folder)
Samples= levels(as.factor(SeuratObj$Sample))

Z="Tcells"
names=c("KEGG","Hallmark","Biocarta","Reactome")
annotpathways2=list()
for(i in 1:length(names)){
  name=names[i]
  annotpathways=list()
  for(x in 1:length(Samples)){
    X=Samples[x]
    Y=read.csv(paste(name, X,Z,".csv"))
    names(Y)[names(Y)=="NES"]=paste(X)

    Y=Y%>%tibble::column_to_rownames("pathway")
    Y=Y[order(row.names(Y)), , drop=F]

    Y=as.data.frame(Y)
    Annot.pathway<-Y[,c(paste(X)),drop=F]
    annotpathways[[x]]=Annot.pathway
  }
  Annot.pathway2=do.call(gdata::cbindX  ,annotpathways)
  annotpathways2[[i]]=Annot.pathway2
}
Annot.pathway3=do.call(rbind    ,annotpathways2)
#Annot.pathway3=Annot.pathway3%>%tibble::column_to_rownames("pathway")

paths=c("KEGG_CHEMOKINE_SIGNALING_PATHWAY", "KEGG_CELL_CYCLE",
        "KEGG_TOLL_LIKE_RECEPTOR_SIGNALING_PATHWAY", "KEGG_APOPTOSIS",
        "KEGG_NATURAL_KILLER_CELL_MEDIATED_CYTOTOXICITY", "REACTOME_TCR_SIGNALING",
        "HALLMARK_INTERFERON_GAMMA_RESPONSE", "HALLMARK_INTERFERON_ALPHA_RESPONSE", "HALLMARK_IL2_STAT5_SIGNALING",
        "HALLMARK_INFLAMMATORY_RESPONSE","HALLMARK_TNFA_SIGNALING_VIA_NFKB",
        "BIOCARTA_CTL_PATHWAY", "BIOCARTA_TCYTOTOXIC_PATHWAY", "BIOCARTA_CCR5_PATHWAY", "BIOCARTA_41BB_PATHWAY")
row.names(Annot.pathway3)=as.character(row.names(Annot.pathway3))
Annot.pathway=Annot.pathway3[paths,]


HM1=pheatmap::pheatmap(Annot.pathway,scale = "none",cluster_rows = T,cluster_cols = F,border_color = "black",treeheight_row = 0,legend_breaks = c(-5,-2,0,2,5),silent = T,
                   fontsize =8, cellwidth = 15,cellheight =10,color= plasma(10),angle_col = 90,
                   main = paste(" ",Z," (NES)")
                   )


Z="NKcells"

annotpathways2=list()
pathgenes2=list()
for(i in 1:length(names)){
  name=names[i]
  annotpathways=list()
  pathgenes=list()

  for(x in 1:length(Samples)){
    X=Samples[x]
    Y=read.csv(paste(name, X,Z,".csv"))
    names(Y)[names(Y)=="NES"]=paste(X)
    names(Y)[names(Y)=="leadingEdge"]=paste0(X,"leadingEdge")

    Y=Y%>%tibble::column_to_rownames("pathway")
    Y=Y[order(row.names(Y)), , drop=F]

    Y=as.data.frame(Y)
    Annot.pathway<-Y[,c(paste(X)),drop=F]
    annotpathways[[x]]=Annot.pathway
    pathway.genes=Y[,c(paste0(X,"leadingEdge")),drop=F]
    pathgenes[[x]]=pathway.genes
  }
  Annot.pathway2=do.call(gdata::cbindX  ,annotpathways)
  annotpathways2[[i]]=Annot.pathway2
  pathway.genes2=do.call(gdata::cbindX  ,pathgenes)
  pathgenes2[[i]]=pathway.genes2
}
Annot.pathway3=do.call(rbind    ,annotpathways2)
pathgenes3=do.call(rbind    ,pathgenes2)

#Annot.pathway3=Annot.pathway3%>%tibble::column_to_rownames("pathway")
paths=c("HALLMARK_INFLAMMATORY_RESPONSE",
        "HALLMARK_INTERFERON_ALPHA_RESPONSE",
        "HALLMARK_MITOTIC_SPINDLE",
        "HALLMARK_INTERFERON_GAMMA_RESPONSE",
        "HALLMARK_TNFA_SIGNALING_VIA_NFKB",
        "HALLMARK_ALLOGRAFT_REJECTION",
        "HALLMARK_IL2_STAT5_SIGNALING",
        "KEGG_NATURAL_KILLER_CELL_MEDIATED_CYTOTOXICITY",
        "KEGG_CHEMOKINE_SIGNALING_PATHWA",
        "BIOCARTA_CCR5_PATHWAY",
        "BIOCARTA_CD40_PATHWAY",
        "BIOCARTA_41BB_PATHWAY",
        "BIOCARTA_FCER1_PATHWAY",
        "BIOCARTA_NKCELLS_PATHWAY",
        "BIOCARTA_FAS_PATHWAY",
        "BIOCARTA_RELA_PATHWAY",
        "BIOCARTA_IL12_PATHWAY",
        "BIOCARTA_TCYTOTOXIC_PATHWAY"

)
row.names(Annot.pathway3)=as.character(row.names(Annot.pathway3))
Annot.pathway=Annot.pathway3[paths,]
pathway.genes=pathgenes3[paths,]

HM2=pheatmap::pheatmap(Annot.pathway,scale = "none",cluster_rows = T,cluster_cols = F,border_color = "black",treeheight_row = 0,legend_breaks = c(-5,-2,0,2,5),silent = T,
                   fontsize =8, cellwidth = 15,cellheight =10,color= plasma(10),angle_col = 90,
                   main = paste(" ",Z," (NES)"))
wrap_plots(list(HM1[[4]],HM2[[4]]))
pdf(paste0(OutputDirectory,"Fig3 e pathway heatmaps.pdf"),width = 11,height =4.5)
wrap_plots(list(HM1[[4]],HM2[[4]]))
dev.off()
## quartz_off_screen
##                 2
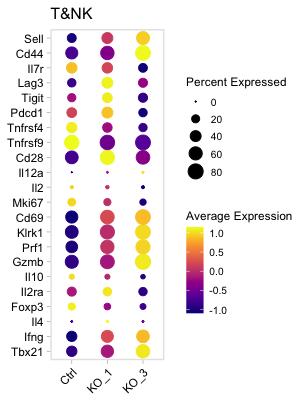
Tgenes=c("Tbx21","Ifng","Il4","Foxp3","Il2ra","Il10","Gzmb","Prf1","Klrk1",
         "Cd69","Mki67","Il2","Il12a","Cd28","Tnfrsf9","Tnfrsf4","Pdcd1","Tigit","Lag3",
         "Il7r","Cd44","Sell")
dp=DotPlot(SeuratObjT,group.by = "Sample",dot.scale = 5 ,features = Tgenes ,scale = T,scale.by = "size")+
  scale_colour_viridis_c(option = "plasma")+
  ggmin::theme_min()+ RotatedAxis()+theme(axis.title = element_blank())+
  labs(title=paste("T&NK"))+coord_flip();dp
## Warning: Scaling data with a low number of groups may produce misleading
## results

## Scale for colour is already present.
## Adding another scale for colour, which will replace the existing scale.
pdf(paste0(OutputDirectory,"Fig3 g dotplot.pdf"),width=3.2,height=4.2)
print(dp)
dev.off()
## quartz_off_screen
##                 2
Figure 4
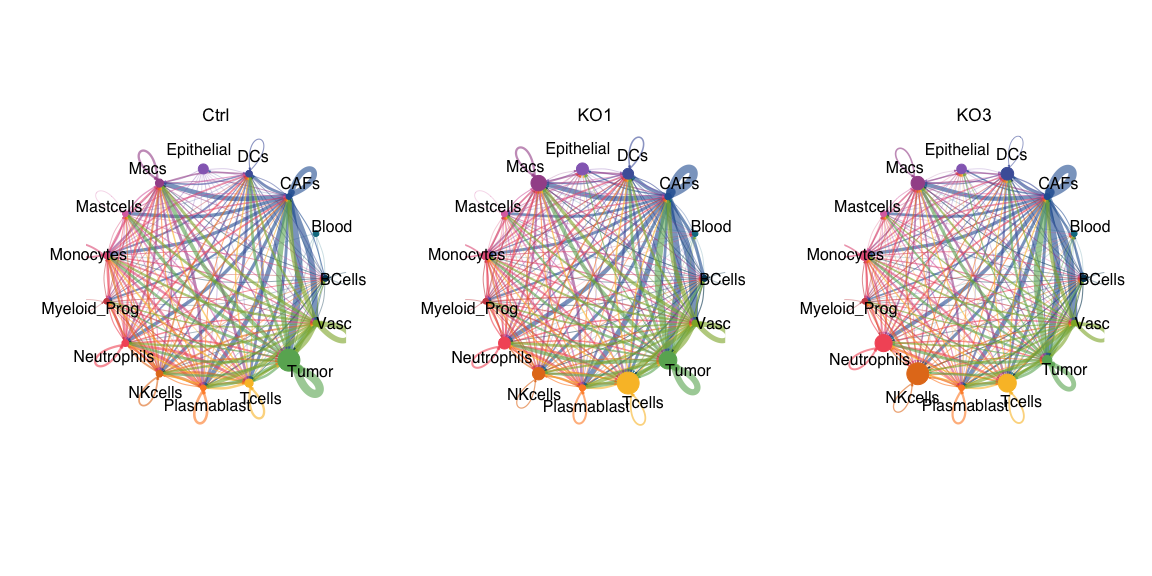
Samples= levels(as.factor(SeuratObj$Sample))

cellchat1=readRDS(paste0(CellChatRobjDirectory,Samples[1],"CellChat.rds"))
cellchat2=readRDS(paste0(CellChatRobjDirectory,Samples[2],"CellChat.rds"))
cellchat3=readRDS(paste0(CellChatRobjDirectory,Samples[3],"CellChat.rds"))
colors=AssignmentColors[levels(cellchat1@meta$group)]

PLOT1=ggpubr::ggarrange(netVisual_circle(cellchat1@net$count, vertex.weight = as.numeric(table(cellchat1@idents)), weight.scale = T,
                 label.edge= F, title.name = "Ctrl",color.use = colors,margin = 0))
PLOT2=ggpubr::ggarrange(netVisual_circle(cellchat2@net$count, vertex.weight = as.numeric(table(cellchat2@idents)), weight.scale = T,
                 label.edge= F, title.name = "KO1",color.use = colors,margin = 0))
PLOT3=ggpubr::ggarrange(netVisual_circle(cellchat3@net$count, vertex.weight = as.numeric(table(cellchat3@idents)), weight.scale = T,
                 label.edge= F, title.name = "KO3",color.use = colors,margin = 0))
wrap_plots(PLOT1,PLOT2,PLOT3)
pdf(paste0(OutputDirectory,"Fig4 a cellchat number of interactions.pdf"),width=12,height=6)
wrap_plots(PLOT1,PLOT2,PLOT3)
dev.off()
## quartz_off_screen
##                 2
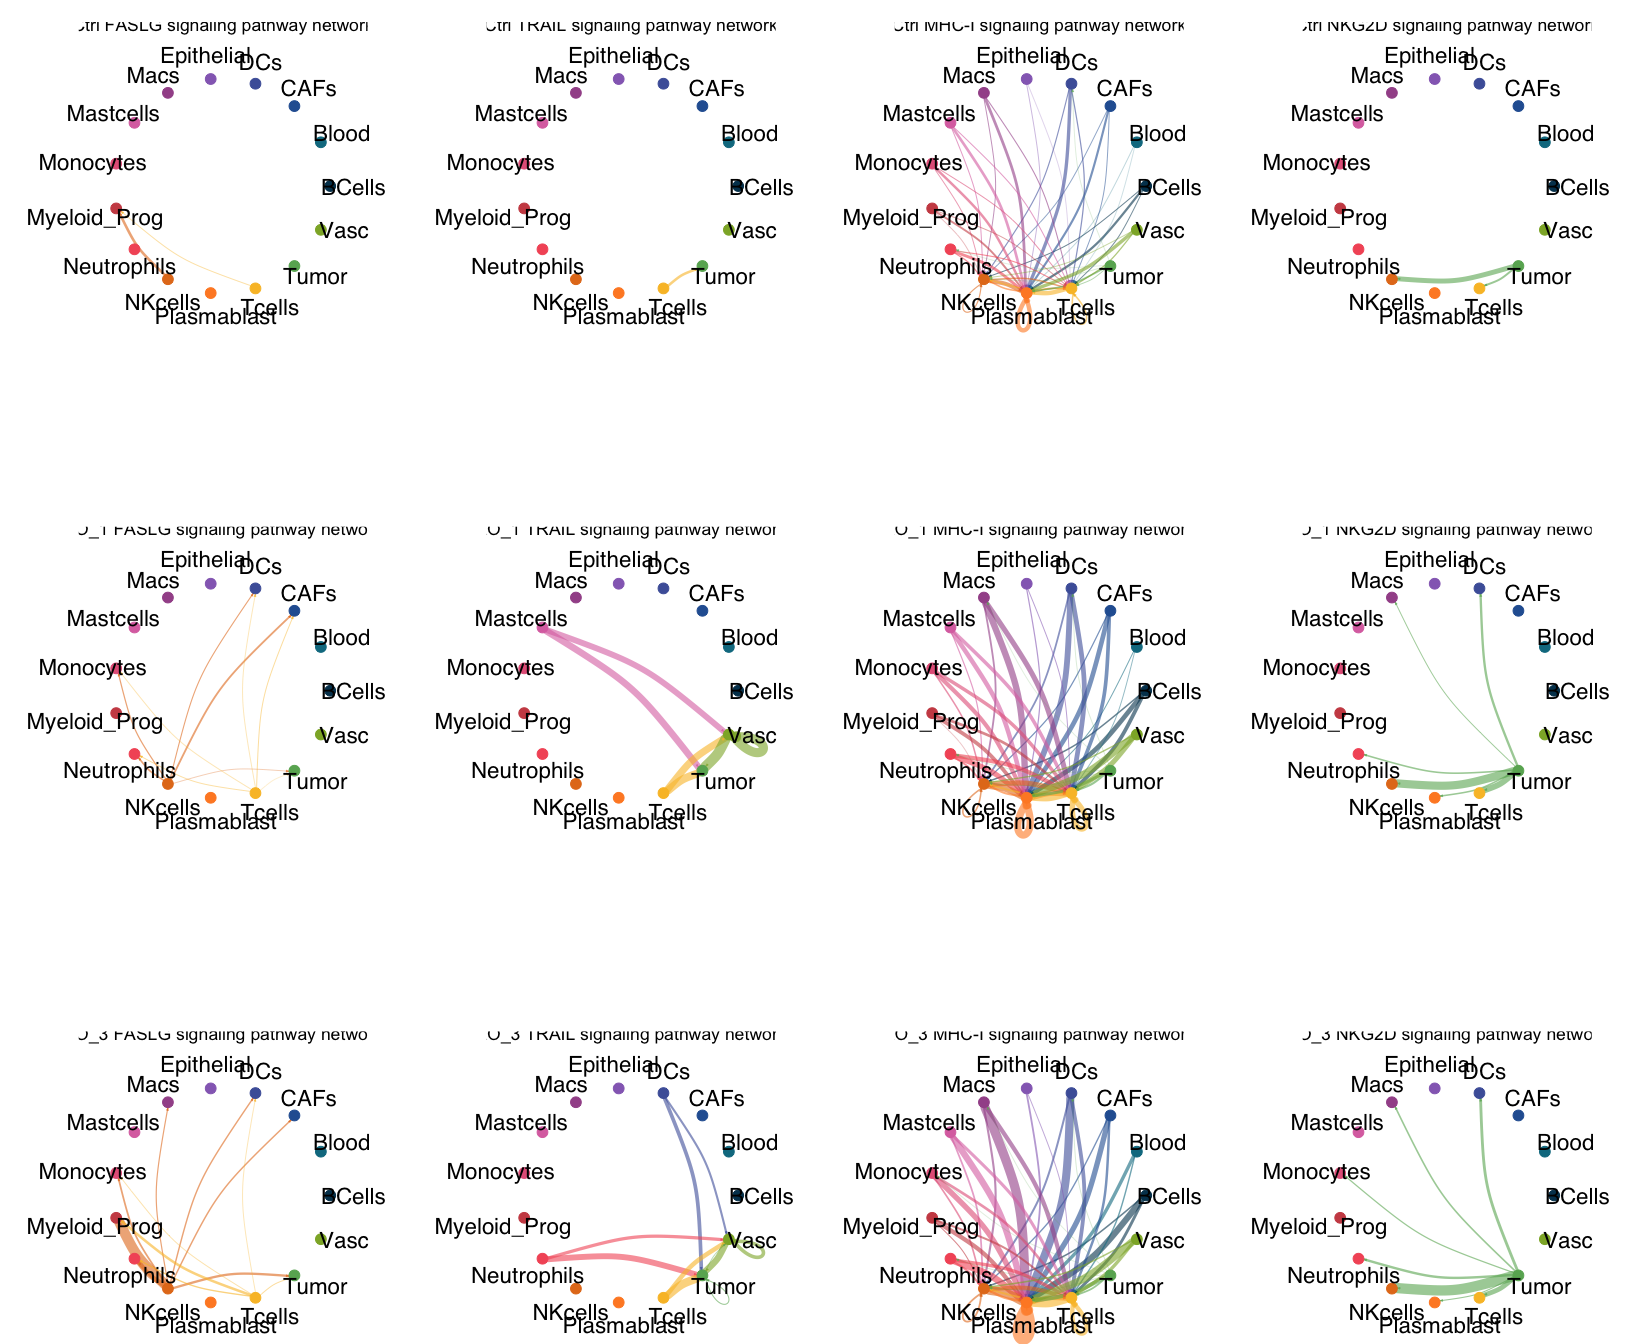
groups.show=levels(cellchat1@idents)

object.list=list(Ctrl=cellchat1,`KO_1`=cellchat2,
                 `KO_3`=cellchat3)
pathways <-c("FASLG","TRAIL", "MHC-I","NKG2D")
plotlist=list()
for (xy in 1:length(pathways)){
  pathways.show <- pathways[xy]

  weights=c()
  list1=list()
  for (zz in 1:length(object.list)){
    weight=try(getMaxWeight(object.list[zz], slot.name = c("netP"), attribute = pathways.show), )
    if(class(weight)=="try-error"){
      weight=NA
    }
    weights[zz]=weight
  }
  weight.max=max(weights,na.rm = T)
  vertex.receiver = seq(1,15)
  par(mfrow = c(1,1), xpd=TRUE)
  for (i in 1:length(object.list)) {
    PLOT1=ggpubr::ggarrange(netVisual_aggregate(object.list[[i]], signaling = pathways.show, vertex.receiver = vertex.receiver,idents.use = groups.show,
                             edge.weight.max = weight.max, edge.width.max = 10,color.use = colors[groups.show], vertex.label.cex = 1.4,
                             signaling.name = paste(names(object.list)[i],pathways.show)))
    list1[[i]]=PLOT1+theme(plot.margin = margin(0,0,0,0, "cm"))
  }


  plotlist[[xy]]=list1

}
PLOT2=wrap_plots(plotlist[[1]][[1]],plotlist[[1]][[2]],plotlist[[1]][[3]],
                 plotlist[[2]][[1]],plotlist[[2]][[2]],plotlist[[2]][[3]],
                 plotlist[[3]][[1]],plotlist[[3]][[2]],plotlist[[3]][[3]],
                 plotlist[[4]][[1]],plotlist[[4]][[2]],plotlist[[4]][[3]],
                 ncol=4,nrow=3,byrow = F);PLOT2&theme(plot.margin = margin(-1.5,0,-3,0, "cm"))
pdf(paste0(OutputDirectory,"Fig4 b cellchat pathways.pdf"),width=17,height=15)
print(PLOT2&theme(plot.margin = margin(-1,0,-3,0, "cm")))
dev.off()
## quartz_off_screen
##                 2
dev.off()
## null device
##           1
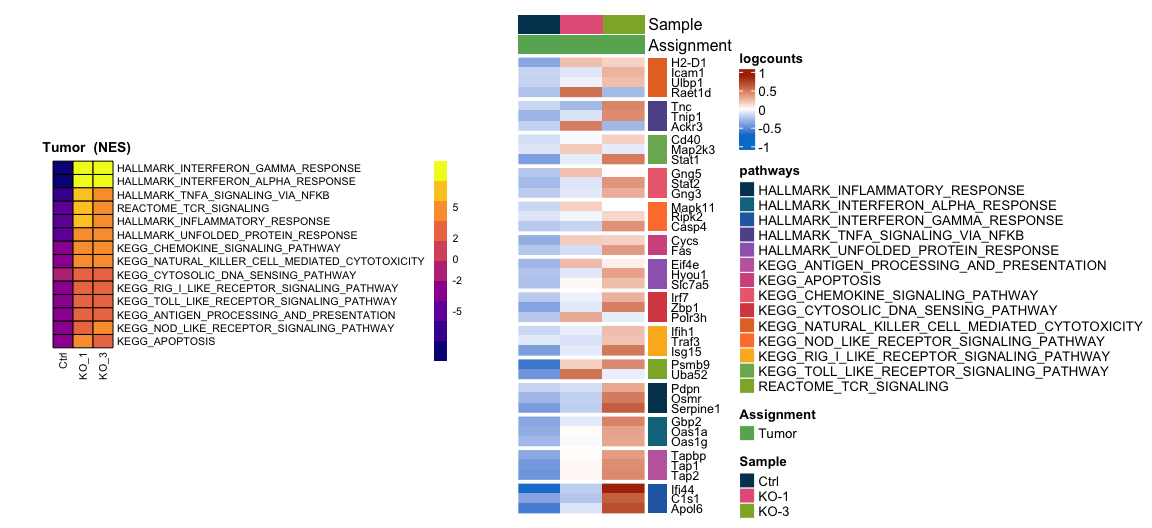
Figure 5
Z="Tumor"
folder= PathwayOutputFolder
setwd(folder)
annotpathways2=list()
pathgenes2=list()
for(i in 1:length(names)){
  name=names[i]
  annotpathways=list()
  pathgenes=list()

  for(x in 1:length(Samples)){
    X=Samples[x]
    Y=read.csv(paste(name, X,Z,".csv"))
    names(Y)[names(Y)=="NES"]=paste(X)
    names(Y)[names(Y)=="leadingEdge"]=paste0(X,"leadingEdge")

    Y=Y%>%tibble::column_to_rownames("pathway")
    Y=Y[order(row.names(Y)), , drop=F]

    Y=as.data.frame(Y)
    Annot.pathway<-Y[,c(paste(X)),drop=F]
    annotpathways[[x]]=Annot.pathway
    pathway.genes=Y[,c(paste0(X,"leadingEdge")),drop=F]
    pathgenes[[x]]=pathway.genes
  }
  Annot.pathway2=do.call(gdata::cbindX  ,annotpathways)
  annotpathways2[[i]]=Annot.pathway2
  pathway.genes2=do.call(gdata::cbindX  ,pathgenes)
  pathgenes2[[i]]=pathway.genes2
}
Annot.pathway3=do.call(rbind    ,annotpathways2)
pathgenes3=do.call(rbind    ,pathgenes2)

#Annot.pathway3=Annot.pathway3%>%tibble::column_to_rownames("pathway")
paths=c("KEGG_CYTOSOLIC_DNA_SENSING",  "KEGG_NOD_LIKE_RECEPTOR_SIGNALING_PATHWAY",
        "KEGG_RIG_I_LIKE_RECEPTOR_SIGNALING_PATHWAY", "KEGG_TOLL_LIKE_RECEPTOR_SIGNALING_PATHWAY", "KEGG_APOPTOSIS",
        "KEGG_CHEMOKINE_SIGNALING_PATHWAY", "KEGG_NATURAL_KILLER_CELL_MEDIATED_CYTOTOXICITY", "REACTOME_TCR_SIGNALING",
        "KEGG_ANTIGEN_PROCESSING_AND_PRESENTATION",
        "HALLMARK_INTERFERON_GAMMA_RESPONSE", "HALLMARK_INTERFERON_ALPHA_RESPONSE", "HALLMARK_UNFOLDED_PROTEIN_RESPONSE",
        "HALLMARK_INFLAMMATORY_RESPONSE","HALLMARK_TNFA_SIGNALING_VIA_NFKB")
row.names(Annot.pathway3)=as.character(row.names(Annot.pathway3))
Annot.pathway=Annot.pathway3[paths,]
pathway.genes=pathgenes3[paths,]

HM1=pheatmap::pheatmap(Annot.pathway,scale = "none",cluster_rows = T,cluster_cols = F,border_color = "black",treeheight_row = 0,legend_breaks = c(-5,-2,0,2,5),
                   fontsize =8, cellwidth = 15,cellheight =10,color= plasma(10),angle_col = 90,
                   main = paste(" ",Z," (NES)"),silent = T)

genesannot=apply(pathway.genes,c(1,2), FUN=function(y){list(eval(parse(text =y)))})
genes=data.frame(row.names(genesannot))
genes=list()
for(i in 1:length(row.names(genesannot))){
  genes[[i]]=as.character(unique(c(eval(parse(text = as.character(genesannot[i,][[1]]))),eval(parse(text = as.character(genesannot[i,][[2]]))),
                          eval(parse(text = as.character(genesannot[i,][[3]]))))))
  names(genes)[i]=row.names(genesannot)[i]
}


genesannotation=reshape::melt.list(genes,level = 1)
genesannotation$genes2=make.unique(genesannotation$value)
genesannotation=genesannotation%>%tibble::column_to_rownames("genes2")
names(genesannotation)=c("genes","pathways")

cellinfosub=SeuratObj@meta.data%>%filter(Assignment%in%c("Tumor"))
seurat_objsub=subset(SeuratObj,cells=row.names(cellinfosub))
markerssample <- wilcoxauc(seurat_objsub , 'Sample',assay = "scale.data",seurat_assay = "RNA")
markerssampletrunk=markerssample%>% filter(feature %in% genesannotation$genes) #%>% filter(group %in% c("Untreated","Scramble","NRF1_mRNA"))
row.annot=genesannotation[markerssampletrunk$feature,"pathways",drop=F]
row.annot=row.annot[order(row.annot$pathways),,drop=F]
merged=merge(markerssampletrunk,row.annot,by.x="feature",by.y=0)
top20.markers <- merged %>% group_by(pathways) %>%
  filter(padj< 0.05)%>% filter(logFC> 0.1)%>% top_n(n = 3, wt = logFC)

Idents(seurat_objsub)=seurat_objsub@meta.data$Sample
avg=AverageExpression(seurat_objsub,features = c(unique(top20.markers$feature),"Ulbp1"),slot = "scale.data")
aver=as.data.frame(avg$RNA)
aver=as.matrix(aver)
annot=as.data.frame(c(colnames(aver)),c(colnames(aver)))
names(annot)="Sample"
annot$Assignment="Tumor"
column.col=c(Ctrl = "#003F5C", 'KO-1' = "#E46388", 'KO-3' = "#8DB032")
column.colors=list()
column.colors[["Sample"]]<-column.col
column.colors[["Assignment"]]<-AssignmentColors["Tumor"]

colanno <- columnAnnotation(df=annot,
                            show_annotation_name =T,show_legend = F,col=column.colors)
plot.data<-aver
plot.data <- plot.data - rowMeans(plot.data)
row.annot=genesannotation[row.names(plot.data),"pathways",drop=F]
row.annot=row.annot[order(row.annot$pathways),,drop=F]


plot.data=plot.data[row.names(row.annot),]
row.cols= c(HALLMARK_INFLAMMATORY_RESPONSE = "#003F5C", HALLMARK_INTERFERON_ALPHA_RESPONSE = "#0E748E",
HALLMARK_INTERFERON_GAMMA_RESPONSE = "#266AB2", HALLMARK_TNFA_SIGNALING_VIA_NFKB = "#605496",
HALLMARK_UNFOLDED_PROTEIN_RESPONSE = "#9E69BB", KEGG_ANTIGEN_PROCESSING_AND_PRESENTATION = "#C26BAC",
KEGG_APOPTOSIS = "#D5578F", KEGG_CHEMOKINE_SIGNALING_PATHWAY = "#EC6D7D",
KEGG_CYTOSOLIC_DNA_SENSING_PATHWAY = "#D84C52", KEGG_NATURAL_KILLER_CELL_MEDIATED_CYTOTOXICITY = "#E5742A",
KEGG_NOD_LIKE_RECEPTOR_SIGNALING_PATHWAY = "#FF7F3D", KEGG_RIG_I_LIKE_RECEPTOR_SIGNALING_PATHWAY = "#FBB621",
KEGG_TOLL_LIKE_RECEPTOR_SIGNALING_PATHWAY = "#79B360", REACTOME_TCR_SIGNALING = "#8DB032"
)
rowcolors=list(pathways=row.cols)

rowanno <- rowAnnotation(df=row.annot,col=rowcolors,
                            show_annotation_name =F,show_legend =T)


col<- circlize::colorRamp2(breaks = c(-0.7, 0, 0.9), colors = c("#007dd1", "white", "#ab3000"))
HM=Heatmap(name="logcounts",as.matrix(plot.data),cluster_rows =T,cluster_columns = F,top_annotation = colanno,right_annotation = rowanno, row_names_gp = gpar(fontsize=60/sqrt(length(row.names(plot.data)))),
           col = col,show_column_names= F,show_row_names=T,show_row_dend = F,row_title_gp = gpar(fontsize=0),border = F,show_heatmap_legend = T,use_raster = T,row_split = row.annot$pathways)
lgd=Legend(title = "logcounts", at=  c(-2,0, 2))
lgd1=Legend(labels = levels(as.factor(annot$Assignment)),title="Assignment",legend_gp = gpar(fill=AssignmentColors["Tumor"],fontsize=25))
lgd2=Legend(labels = levels(as.factor(annot$Sample)),title="Sample",legend_gp = gpar(fill=column.col,fontsize=25))

gTree <- grid.grabExpr({
      draw(HM,heatmap_legend_list = list(lgd1, lgd2), heatmap_legend_side = "right")})
HM2=wrap_plots(gTree)
plots=wrap_plots(list(HM1[[4]],HM2),widths = c(1,1.3));print(plots)
pdf(paste0(OutputDirectory,"Fig5a pathway heatmaps.pdf"),width = 12,height =5.5)
print(plots)
dev.off()
## quartz_off_screen
##                 2