Timilsina-FOXM1-Manuscript-Figs /
SupplementaryFigures.md
SupplementaryFigures.md
Timilsina et al Supplementary figures
Nourhan Abdelfattah 2024-11-8
library(easypackages)
MyPackages<-c("dplyr","ggplot2","ggpubr","gridExtra","viridis","egg","presto","ComplexHeatmap",
              "Seurat","cowplot","patchwork","stringr", "ggmin","SingleCellExperiment","CellChat")
libraries(MyPackages)


SeuratObj=readRDS(paste0(RobjDirectory,"SantoshAllClustersnew.rds"))
SeuratObjT=readRDS(paste0(RobjDirectory,"TandNKcellsonlyNew.rds"))


##color palettes needed
SampleColors=c(Ctrl = "#003F5C", KO_1 = "#E46388", KO_3 = "#8DB032")
ClusterColors=c(C01 = "#8DB032", C02 = "#61AA4F", C03 = "#60AD62", C04 = "#C9C759",
                C05 = "#F8C238", C06 = "#FEA905", C07 = "#FF9022", C08 = "#FB7B3E",
                C09 = "#E97B25", C10 = "#E6722E", C11 = "#F5615E", C12 = "#DE4F56",
                C13 = "#BE3F40", C14 = "#DF606C", C15 = "#EE6E88", C16 = "#DA5787",
                C17 = "#D8629C", C18 = "#DF80BE", C19 = "#BC66A8", C20 = "#9F559B",
                C21 = "#9E68B9", C22 = "#8C67B6", C23 = "#6B5496", C24 = "#4566B1",
                C25 = "#227ACD", C26 = "#2A5C9A", C27 = "#235982", C28 = "#087C91",
                C29 = "#00697E", C30 = "#003F5C")
AssignmentColors=c(BCells = "#003F5C", Blood = "#0A7A90", CAFs = "#2960A1", DCs = "#4D61A8",
                   Epithelial = "#956CBF", Macs = "#A45498", Mastcells = "#DC73B0",
                   Monocytes = "#E46388", Myeloid_Prog = "#CD4E53", Neutrophils = "#F45A66",
                   NKcells = "#E47B1E", Plasmablast = "#FF8B2B", Tcells = "#F9BF31",
                   Tumor = "#68AF61", Vasc = "#8DB032")
TAssignmentColors=c(`Activated TCells` = "#003F5C", `CD4+ TCells` = "#205D83",
`CD8+ TCells` = "#3D6BB9", doublet = "#9E6DC1", `Effector CD4+ TCells` = "#D378B8",
`Effector Memory` = "#E46388", `Exhasted CD8+ TCells` = "#C94446",
`Naiive TCells-CD8+` = "#E27820", NKcells = "#FF951A", `Proliferating TCells` = "#BFC45A",
Treg = "#8DB032")
Supplementary Figure 4a
#please refer to the output of infercnv::run
plot_cnv(infercnv_object,
         out_dir=OutputDirectory
         )
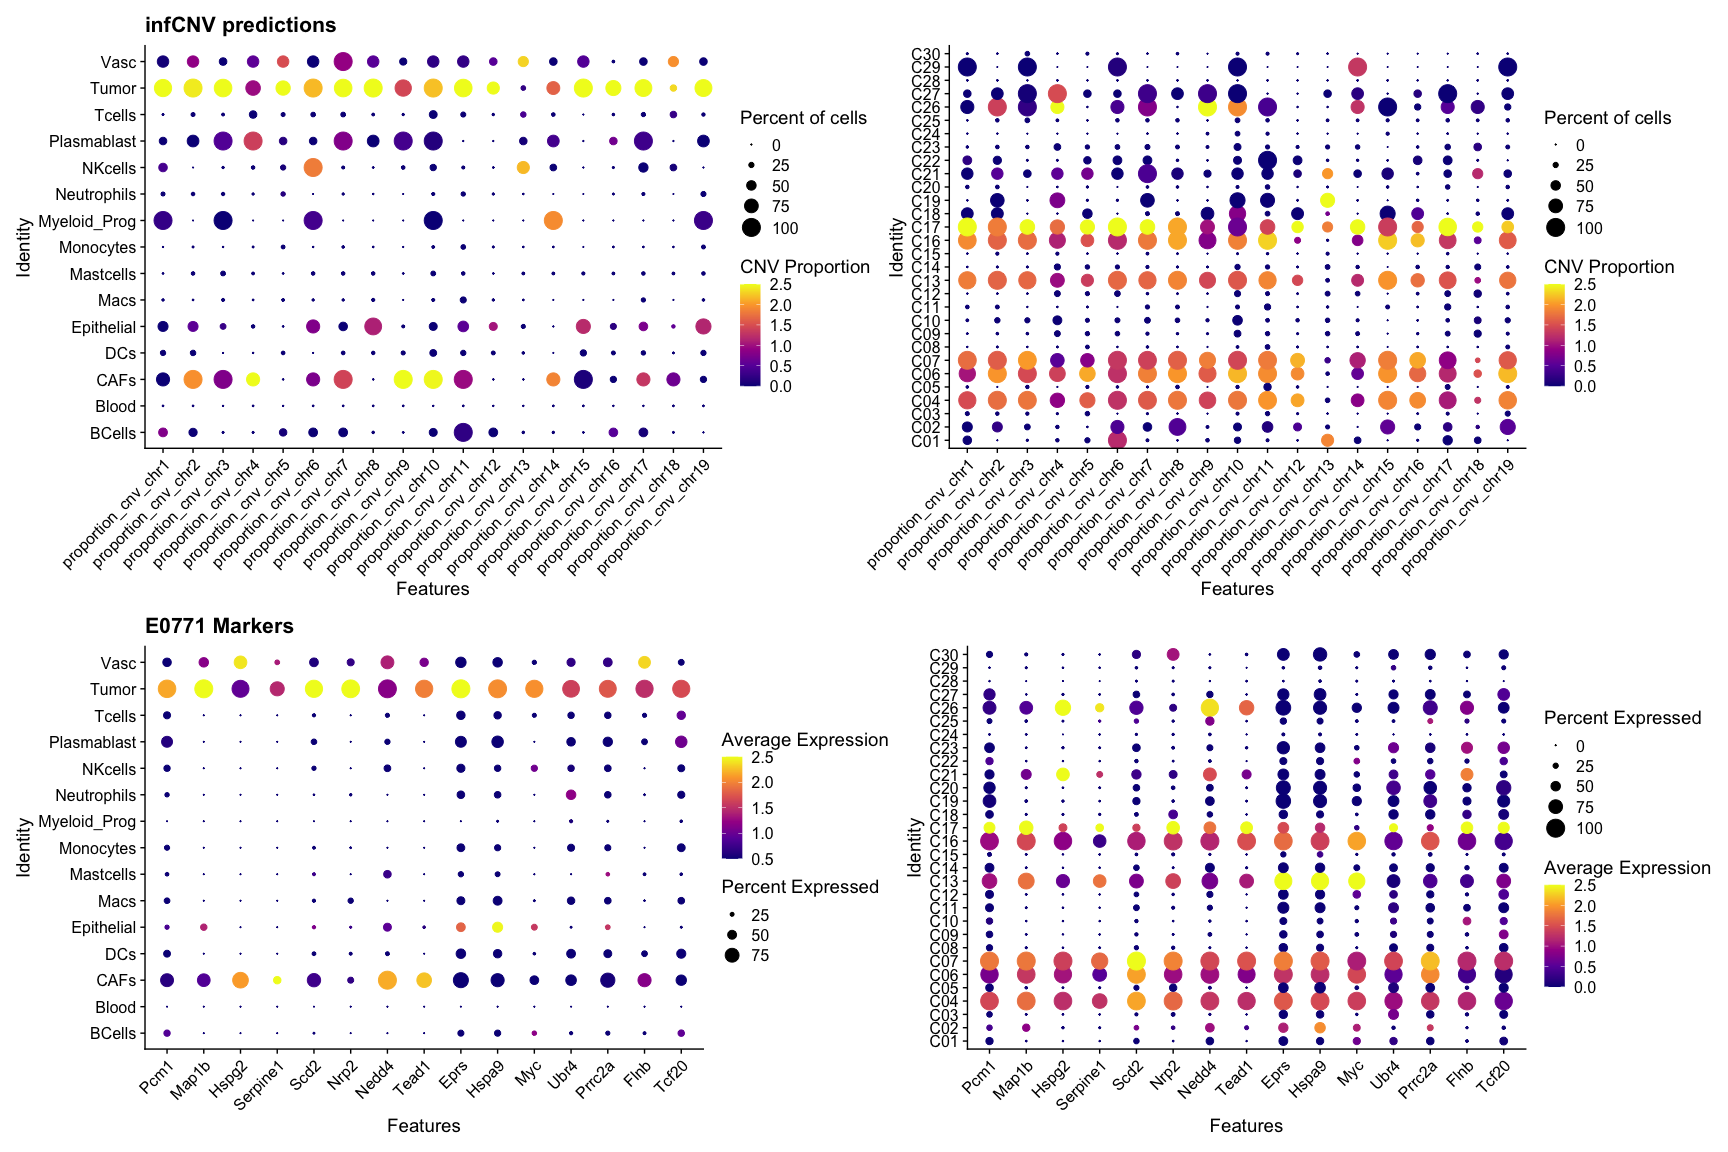
Supplementary Figure 5a
#please refer to the output of infercnv::run
#mapmeta=read.delim(file = paste0("./infercnv/map_metadata_from_infercnv.txt"))
SeuratObj=AddMetaData(SeuratObj,mapmeta)
P1=DotPlot(SeuratObj,group.by = "Assignment",features = c("proportion_cnv_chr1", "proportion_cnv_chr2", "proportion_cnv_chr3",
                                                       "proportion_cnv_chr4", "proportion_cnv_chr5", "proportion_cnv_chr6",
                                                       "proportion_cnv_chr7", "proportion_cnv_chr8", "proportion_cnv_chr9",
                                                       "proportion_cnv_chr10", "proportion_cnv_chr11", "proportion_cnv_chr12",
                                                       "proportion_cnv_chr13", "proportion_cnv_chr14", "proportion_cnv_chr15",
                                                       "proportion_cnv_chr16", "proportion_cnv_chr17", "proportion_cnv_chr18",
                                                       "proportion_cnv_chr19"),col.min = 0,scale = T#,scale.by = "size"
)+RotatedAxis() +scale_colour_viridis_c(option = "plasma")+ggtitle("infCNV predictions")+
  DotPlot(SeuratObj,group.by = "Cluster",features = c("proportion_cnv_chr1", "proportion_cnv_chr2", "proportion_cnv_chr3",
                                                   "proportion_cnv_chr4", "proportion_cnv_chr5", "proportion_cnv_chr6",
                                                   "proportion_cnv_chr7", "proportion_cnv_chr8", "proportion_cnv_chr9",
                                                   "proportion_cnv_chr10", "proportion_cnv_chr11", "proportion_cnv_chr12",
                                                   "proportion_cnv_chr13", "proportion_cnv_chr14", "proportion_cnv_chr15",
                                                   "proportion_cnv_chr16", "proportion_cnv_chr17", "proportion_cnv_chr18",
                                                   "proportion_cnv_chr19"),col.min = 0)+RotatedAxis() +scale_colour_viridis_c(option = "plasma")
P1[[1]][["guides"]][["guides"]][["colour"]][["params"]][["title"]]="CNV Proportion"
P1[[2]][["guides"]][["guides"]][["colour"]][["params"]][["title"]]="CNV Proportion"
P1[[1]][["guides"]][["guides"]][["size"]][["params"]][["title"]]="Percent of cells"
P1[[2]][["guides"]][["guides"]][["size"]][["params"]][["title"]]="Percent of cells"

P2=DotPlot(SeuratObj,group.by = "Assignment",features = c("Pcm1","Map1b","Hspg2","Serpine1","Scd2","Nrp2","Nedd4",
                                                       "Tead1","Eprs","Hspa9","Myc","Ubr4","Prrc2a","Flnb","Tcf20"),col.min = 0.5,scale.min = 10)+ggtitle("E0771 Markers")+RotatedAxis() +scale_colour_viridis_c(option = "plasma") +
  DotPlot(SeuratObj,group.by = "Cluster",features = c("Pcm1","Map1b","Hspg2","Serpine1","Scd2","Nrp2","Nedd4","Tead1","Eprs","Hspa9","Myc","Ubr4","Prrc2a","Flnb","Tcf20"),col.min = 0)+RotatedAxis() +scale_colour_viridis_c(option = "plasma") ;P1/P2
pdf(paste0(OutputDirectory,"Supplementary Figure 5a.pdf"),height=12,width=18)
P1/P2
dev.off()
## quartz_off_screen
##                 2
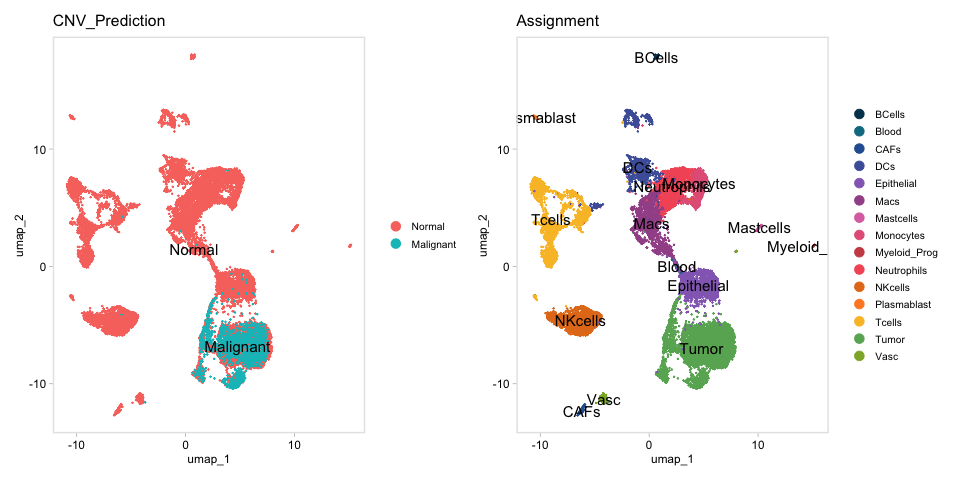
Supplementary Figure 5b
infCNVassay=CreateAssayObject(t(mapmeta[,-1]))
SeuratObj@assays[["infCNV"]]=infCNVassay
SeuratObj <-  AddModuleScore(SeuratObj,assay = "infCNV",slot = "counts",nbin = 20,
                             features = list(`infCNV prediction` = c("proportion-cnv-chr1", "proportion-cnv-chr2",
                                                                     "proportion-cnv-chr3", "proportion-cnv-chr4", "proportion-cnv-chr5",
                                                                     "proportion-cnv-chr6", "proportion-cnv-chr7", "proportion-cnv-chr8",
                                                                     "proportion-cnv-chr9", "proportion-cnv-chr10", "proportion-cnv-chr11",
                                                                     "proportion-cnv-chr12", "proportion-cnv-chr13", "proportion-cnv-chr14",
                                                                     "proportion-cnv-chr15", "proportion-cnv-chr16", "proportion-cnv-chr17",
                                                                     "proportion-cnv-chr18")),
                             ctrl = 1,
                             name = "infCNVScore")
colnames(SeuratObj@meta.data)[colnames(SeuratObj@meta.data)=="infCNVScore1"]="infCNVMetaScore"

q=quantile(SeuratObj$infCNVMetaScore,probs=0.9)
SeuratObj@meta.data=SeuratObj@meta.data%>%mutate(CNV_Prediction=ifelse(infCNVMetaScore>q,"Malignant","Normal"))
p=DimPlot(SeuratObj,group.by = "CNV_Prediction",label = T,order = "Malignant")+DimPlot(SeuratObj,group.by = "Assignment",label = T,cols=AssignmentColors)&ggmin::theme_min();p
pdf(paste0(OutputDirectory,"Supplementary Figure 5b.pdf"),height=5,width=10)
print(p)

dev.off()
## quartz_off_screen
##                 2
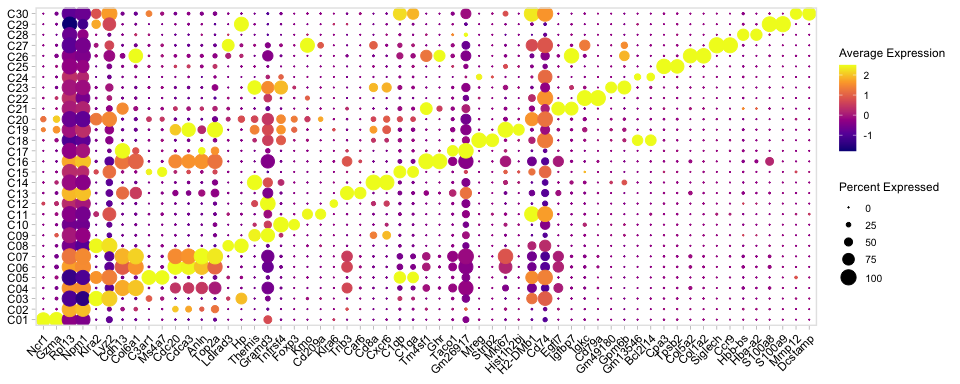
Supplementary Figure 6a
markers <- wilcoxauc(SeuratObj , 'Cluster',assay = "scale.data")
markers=markers[order(markers$group),]

top2 <- markers %>% group_by(group) %>% top_n(n =2, wt = logFC)
top2=top2[order(top2$group),]
genes= top2$feature

p=DotPlot(SeuratObj,group.by = "Cluster",dot.scale = 5 ,features = unique(genes) ,scale = T)+scale_colour_viridis_c(option = "plasma")+
  ggmin::theme_min()+ RotatedAxis()+theme(axis.title = element_blank());p
pdf(paste0(OutputDirectory,"Supplementary Figure 6a.pdf"),width=10,height=4)
print(p)
dev.off()
## quartz_off_screen
##                 2
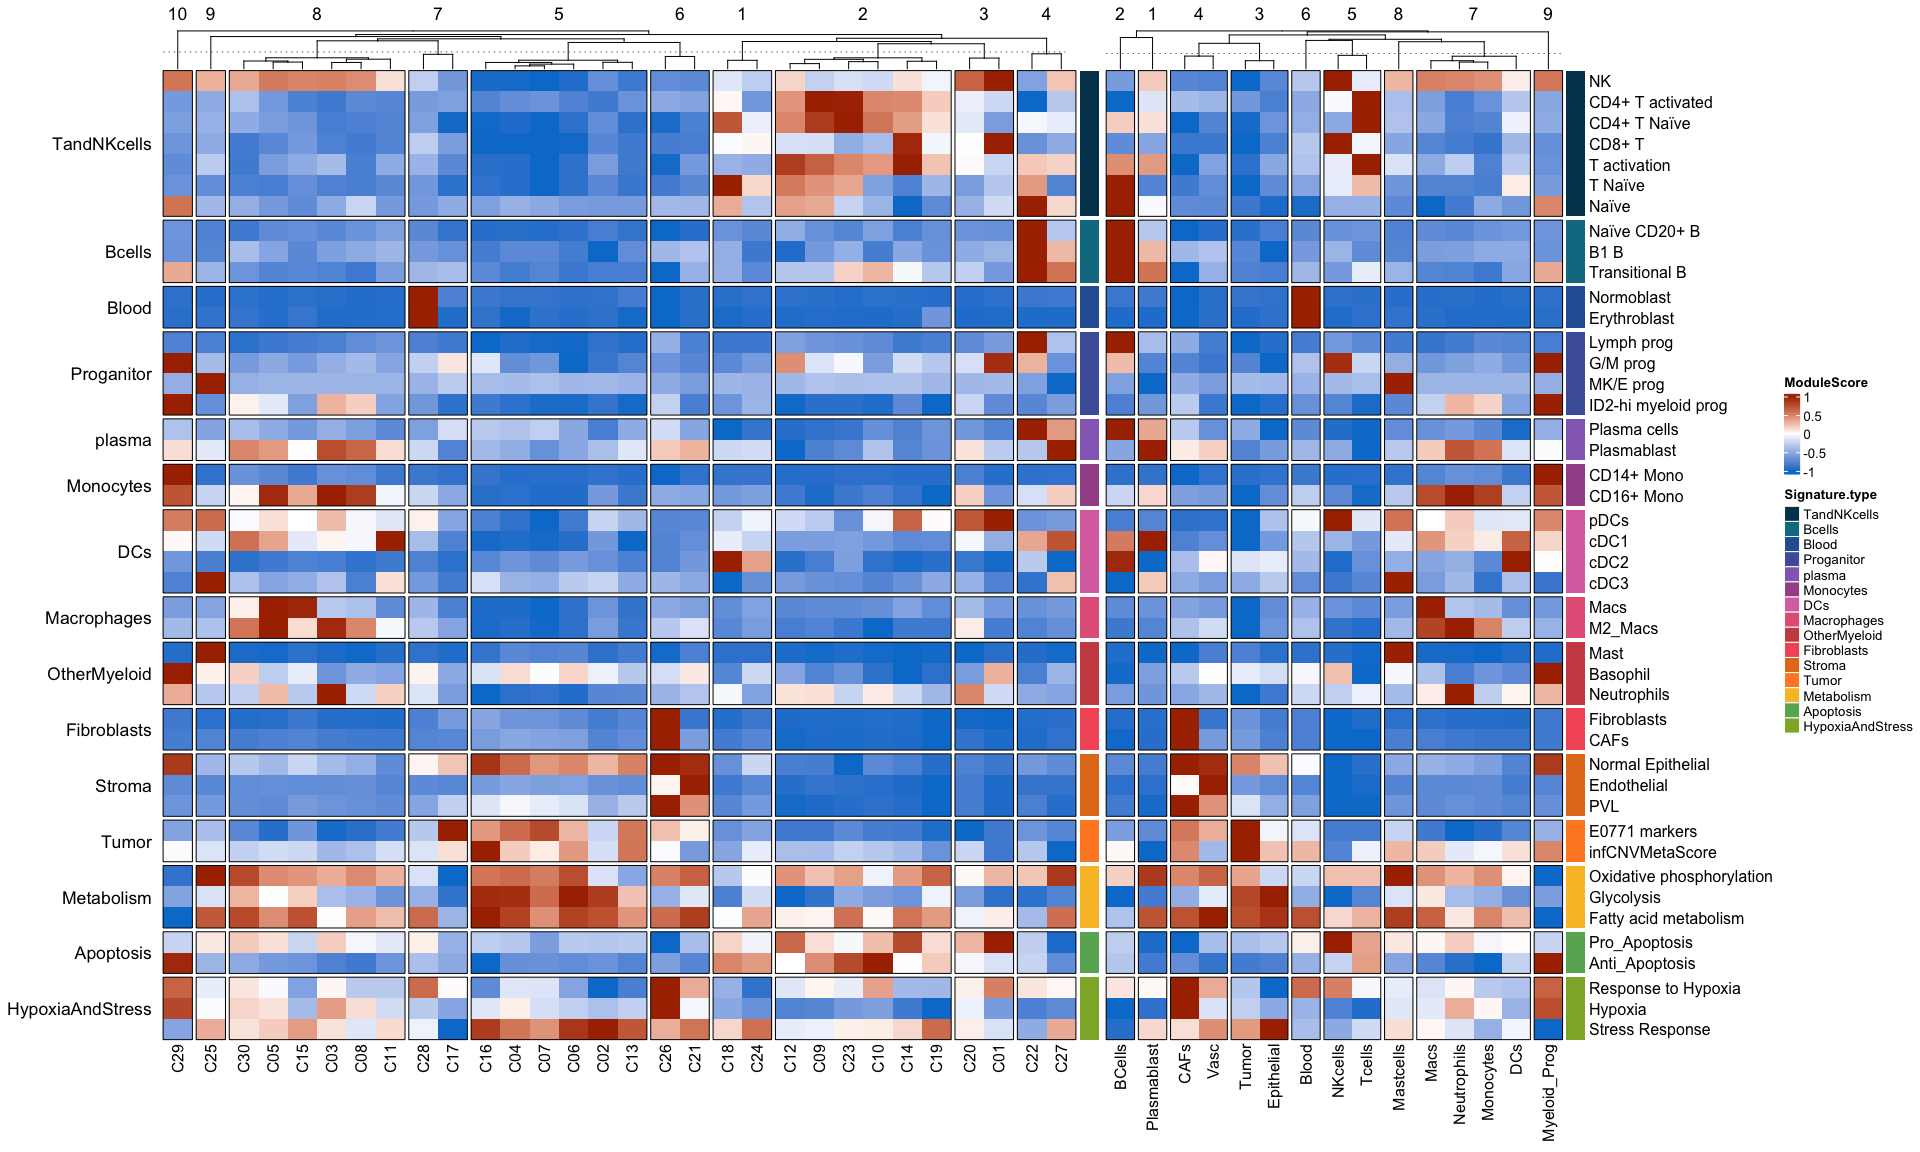
Supplementary Figure 6b
#refer to preprocessing for module scoring using seurat:: AddModuleScore of these signatures
TandNKcells <-c("NK",
                "CD4+ T activated", "CD4+ T Naïve",
                "CD8+ T", "T activation", "T Naïve","Naïve"
)
Bcells <- c("Naïve CD20+ B", "B1 B", "Transitional B")
Blood <- c("Normoblast", "Erythroblast"#, "Proerythroblast"
)
Proganitor= c("Lymph prog","G/M prog",#"HSC",
              "MK/E prog","ID2-hi myeloid prog")
plasma= c("Plasma cells", "Plasmablast")
Monocytes <- c( "CD14+ Mono", "CD16+ Mono")
OtherMyeloid =c("Mast","Basophil", "Neutrophils")
Fibroblasts=c("Fibroblasts",#"Keratinocytes",
              "CAFs")
DCs <- c( "pDCs","cDC1", "cDC2", "cDC3")
Macrophages <- c( "Macs","M2_Macs")
Metabolism <- c("Oxidative phosphorylation", "Glycolysis", "Fatty acid metabolism")
Apoptosis <- c("Pro_Apoptosis", "Anti_Apoptosis")
Tumor <-c("E0771 markers","infCNVMetaScore")
Stroma <- c("Normal Epithelial","Endothelial","PVL")
HypoxiaAndStress <- c("Response to Hypoxia","Hypoxia","Stress Response")


MarkerNameVector <- c(TandNKcells, Bcells,Blood, Proganitor,plasma,Monocytes,DCs,Macrophages,OtherMyeloid,
                      Fibroblasts,Stroma,Tumor,Metabolism, Apoptosis,HypoxiaAndStress)
FunctionScoreMatrix <- matrix(0,
                              ncol = length(unique(SeuratObj$Cluster)),
                              nrow = length(marker.list))
colnames(FunctionScoreMatrix) <- levels(as.factor(SeuratObj$Cluster))
rownames(FunctionScoreMatrix) <- MarkerNameVector
library(scales)
SeuratObj$Cluster=factor(SeuratObj$Cluster)
for(ci in 1:ncol(FunctionScoreMatrix)){
  for(ri in 1:nrow(FunctionScoreMatrix)){
    FunctionVec <- as_tibble(SeuratObj@meta.data) %>% pull(MarkerNameVector[ri])
    fv <- mean(FunctionVec[SeuratObj$Cluster == levels(SeuratObj$Cluster)[ci]])
    FunctionScoreMatrix[ri, ci] <- fv
  }
}
FunctionScoreMatrix <- t(apply(FunctionScoreMatrix, 1, rescale  , to=c(-1, 1)))


signatureType_row <- data.frame(Signature.type = c(
  rep("TandNKcells", length(TandNKcells)),
  rep("Bcells", length(Bcells)),
  rep("Blood", length(Blood)),
  rep("Proganitor", length(Proganitor)),  rep("plasma", length(plasma)),
  rep("Monocytes", length(Monocytes)),  rep("DCs", length(DCs)),
  rep("Macrophages", length(Macrophages)),  rep("OtherMyeloid", length(OtherMyeloid)),
  rep("Fibroblasts", length(Fibroblasts)), rep("Stroma", length(Stroma)), rep("Tumor", length(Tumor)),
  rep("Metabolism", length(Metabolism)),
  rep("Apoptosis", length(Apoptosis)),rep("HypoxiaAndStress", length(HypoxiaAndStress))))
rownames(signatureType_row) <- MarkerNameVector
signatureType_row$Signature.type=factor(signatureType_row$Signature.type,levels =unique(signatureType_row$Signature.type) )
frq=as.data.frame(table(signatureType_row))

RowColors= c("#003F5C", "#0A7A90", "#2960A1", "#4D61A8", "#956CBF", "#A45498",
"#DC73B0", "#E46388", "#CD4E53", "#F45A66", "#E47B1E", "#FF8B2B",
"#F9BF31", "#68AF61", "#8DB032")
names(RowColors)= levels(as.factor(signatureType_row$Signature.type))
Rcol=list('Signature.type'=RowColors)
rowanno <- rowAnnotation(df=signatureType_row,
                         show_annotation_name =F,show_legend = T,col=Rcol)
col<- circlize::colorRamp2(breaks = c(-1, 0, 1), colors = c("#007dd1", "white", "#ab3000"))

H1=Heatmap(name = "ModuleScore",FunctionScoreMatrix,right_annotation =rowanno,row_split = signatureType_row$Signature.type,
           column_km = 10,
           cluster_rows = F ,col = col,show_column_dend = T,row_title_rot = 0,
           row_title_side = "left",border = "black")


FunctionScoreMatrix2 <- matrix(0,
                               ncol = length(unique(SeuratObj$Assignment)),
                               nrow = length(marker.list))
colnames(FunctionScoreMatrix2) <- levels(as.factor(SeuratObj$Assignment))
rownames(FunctionScoreMatrix2) <- MarkerNameVector
library(scales)
SeuratObj$Assignment=factor(SeuratObj$Assignment)
for(ci in 1:ncol(FunctionScoreMatrix2)){
  for(ri in 1:nrow(FunctionScoreMatrix2)){
    FunctionVec <- as_tibble(SeuratObj@meta.data) %>% pull(MarkerNameVector[ri])
    fv <- mean(FunctionVec[SeuratObj$Assignment == levels(SeuratObj$Assignment)[ci]])
    FunctionScoreMatrix2[ri, ci] <- fv
  }
}
FunctionScoreMatrix2 <- t(apply(FunctionScoreMatrix2, 1, rescale    , to=c(-1, 1)))
H2=Heatmap(name = "ModuleScore",FunctionScoreMatrix2,right_annotation =rowanno,row_split = signatureType_row$Signature.type,
           column_km = 9,
           cluster_rows = F ,col = col,show_column_dend = T,row_title_rot = 0,
           row_title_side = "left",border = "black")
H1+H2
pdf(paste0(OutputDirectory,"Supplementary Figure 6b.pdf"),width = 20,height =12)
H1+H2
dev.off()
## quartz_off_screen
##                 2
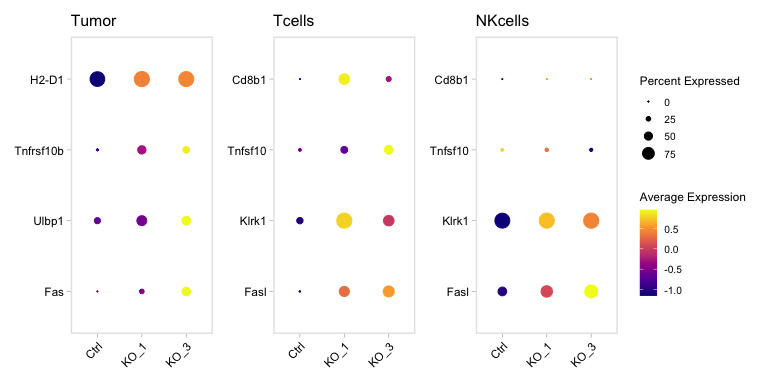
Supplementary Figure 7b
Immune=c("Fasl","Klrk1",#"Hcst",
         "Tnfsf10","Cd8b1")
Tumor=c("Fas","Ulbp1","Tnfrsf10b","H2-D1")

Idents(SeuratObj)=SeuratObj$Assignment
p1=DotPlot(SeuratObj,group.by = "Sample",idents="Tumor",dot.scale = 5 ,features = Tumor ,scale = T)+
  scale_colour_viridis_c(option = "plasma")+
  ggmin::theme_min()+ RotatedAxis()+theme(axis.title = element_blank())+
  labs(title=paste("Tumor"))+coord_flip()+NoLegend()

p2=DotPlot(SeuratObj,group.by = "Sample",idents="Tcells",dot.scale = 5 ,features = Immune ,scale = T)+
  scale_colour_viridis_c(option = "plasma")+
  ggmin::theme_min()+ RotatedAxis()+theme(axis.title = element_blank())+
  labs(title=paste("Tcells"))+coord_flip()+NoLegend()

p3=DotPlot(SeuratObj,group.by = "Sample",idents="NKcells",dot.scale = 5 ,features = Immune ,scale = T)+
  scale_colour_viridis_c(option = "plasma")+
  ggmin::theme_min()+ RotatedAxis()+theme(axis.title = element_blank())+
  labs(title=paste("NKcells"))+coord_flip();p1+p2+p3
pdf(paste0(OutputDirectory,"Supplementary Figure 7b.pdf"),width=8,height=4)
p1+p2+p3
dev.off()
## quartz_off_screen
##                 2