CRYPTOVISUAL_SYSTEM
FOR EMPLOYMENT PURPOSES ONLY
CRYPTOVISUAL is a realtime global cryptocurrency chart created with TouchDesigner and Python. Chart displays the top ten most dominating cryptocurrencies in the market. Visual displays coins ranked in order starting from coin with the highest global percentage.
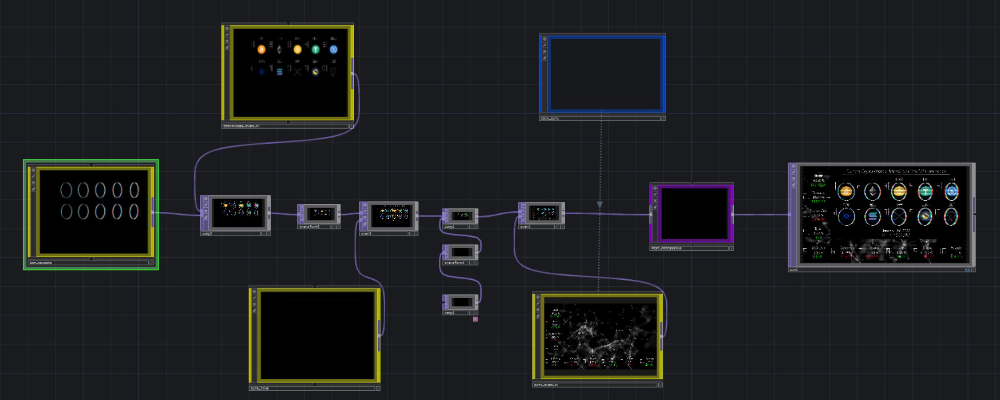
Prices and current ranking are updated every minute. Current market percentage is updated every 5 minutes. OHLC (red / green price color) is updated every 30 minutes; but the time can be adjusted from within Touchdesigner by adjusting the TimerCHOP values.
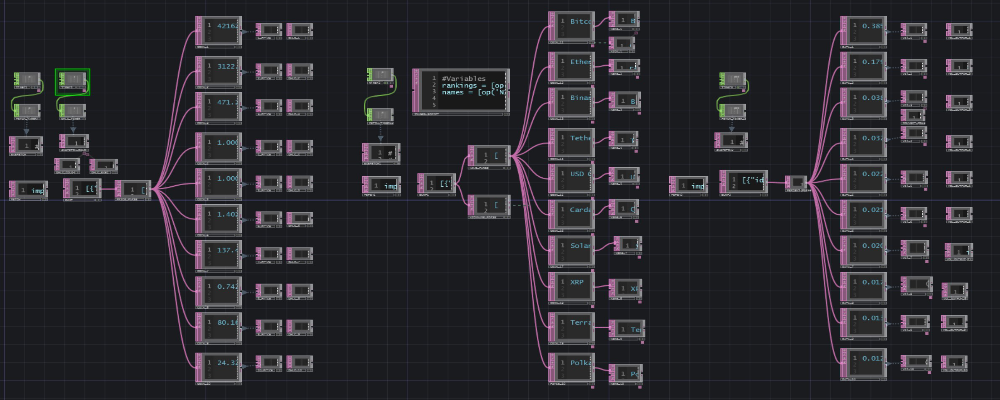
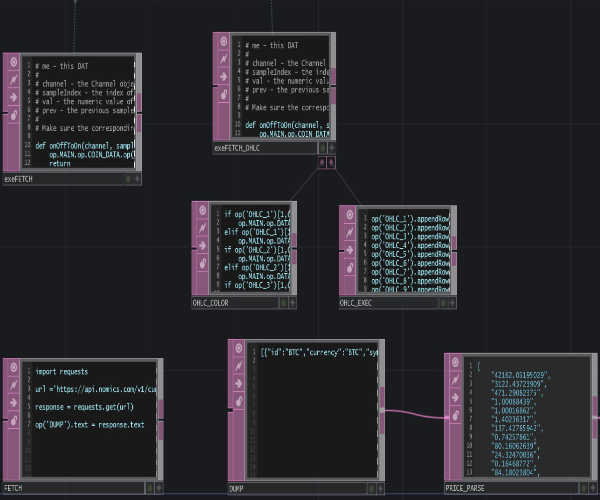
Data is called using REQUESTS library. Data is fetched using NOMICS.COM API. JSON is then parsed using the JSON dat rather than the usual JSON.parse() method. Data is read and finally sent to the front end (TOP operators) to be vizualized.
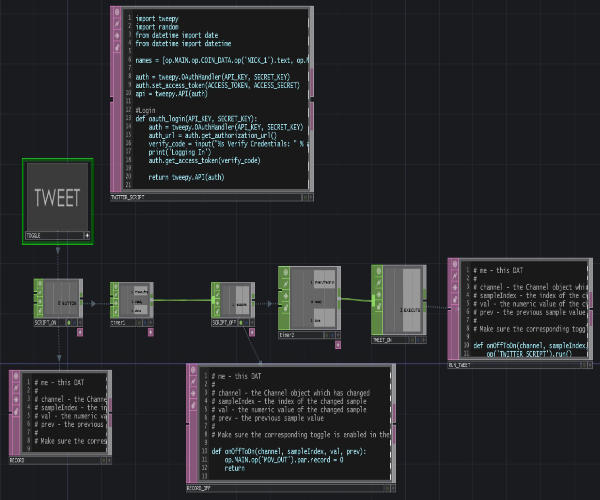
Inside CRYPTOVISAL there is a script that I created for myself that allows me to upload and tweet daily to a twitter bot I created all with the simple click of the TWEET button:
https://twitter.com/dn_CRYPTOVISUAL